Popular Post

_

Thursday, December 28, 2017

My comments on "The End of #CloudComputing"

Source: https://a16z.com/2016/12/16/the-end-of-cloud-computing/


Here is my comments:
- IoT replaces the Cloud with Fog computing. It is wise to process data just where it is captured like the human nervous system does a lot of processing before sending information to the brain.
- So centralized cloud would still be needed as a background ML engine to process big data, maybe....
- Data should be decentralized too and blockchain technology is the way to do that.
- Buttomeline is the optimal structure should be combination of centralized and decentralized computing/data processing. Again like human synergistic loop concept: smart sensors -  spine brain -  brain - back to muscles,

R or Python? Six Reasons To Learn R For Business

DS4B Tool Ratings

About Python

Python is a general service programming language developed by software engineers that has solid programming libraries for math, statistics and machine learning. Python has best-in-class tools for pure machine learning and deep learning, but lacks much of the infrastructure for subjects like econometrics and communication tools such as reporting. Because of this, Python is well-suited for computer scientists and software engineers.

About R

R is a statistical programming language developed by scientists that has open source libraries for statistics, machine learning, and data science. R lends itself well to business because of its depth of topic-specific packages and its communciation infrastructure. R has packages covering a wide range of topics such as econometrics, finance, and time series. R has best-in-class tools for visualization, reporting, and interactivity, which are as important to business as they are to science. Because of this, R is well-suited for scientists, engineers and business professionals.

What Should You Do?

Don’t make the decision tougher than what it is. Think about where you are coming from:
  • Are you a computer scientist or software engineer? If yes, choose Python.
  • Are you an analytics professional or mechanical/industrial/chemical engineer looking to get into data science? If yes, choose R.
Think about what you are trying to do:
  • Are you trying to build a self-driving car? If yes, choose Python.
  • Are you trying to communicate business analytics throughout your organization? If yes, choose R.

Tuesday, December 26, 2017

#CMGnews 2017 #Hackathon Winner - "Laissez Passer", #Blockchain Based #Identity System (#MobileApp)

Saturday, December 16, 2017

How to do Capacity Management in the Cloud


Speaking about System (on Cloud)  Management by Exception - the main topic of this blog - the  anomaly (exception) detection become extremely important technique as based on that video there is apparent shift from protectiveness (classical capacity management) to reactivates. So  the SETDS method works  well applying now to cloud capacity/performance data.   

Thursday, December 7, 2017

NCA CMG meetup meeting 12/6/2017 (Capacity Management on Cloud vs. on-Prem and z/OS Performance HOT Topics)


  • (0:02:17) Capacity Planning for Pervasive Encryption with zBNA - Kathy Walsh, IBM Distinguished Engineer - Abstract: This session will discuss the capacity planning methods and tools available to gain a better understanding of the impact of a pervasive encryption implementation strategy. The session will discuss the system requirements necessary to build a capacity plan and will review the steps necessary to complete the planning. Information on both DFSMS data set encryption and CF structure encryption will be shared. The capability to estimate the capacity impact on current and future technology such as a z14 processor will be covered.
  • (01:08:00) Sponsor presentation: Talend | Open Source Cloud Integration Abstract: Talend is a next-generation leader in cloud and big data integration software. With Talend, you can spin up and spin down EMR clusters so you never waste resources and add unneeded expenses to your AWS account. At scale, this can save organizations millions. 
    Presenters: Karim Sharara (Account Executive)  and Vincent Wilmot (Senior Solutions Engineer)
  • (02:09:00 - Partial Capture) Is Capacity Management Needed in the Cloud? - Kevin McLaughlin (https://cmgimpact.com/speakers/kevin-mclaughlin/) Capital One director (he will repeat his Velocity and CMG imPACT’17 conferences presentation) - Abstract: The cloud holds the promise of bottomless capacity, available instantly. Recently, Capital One has been shifting a significant portion of its workload to the public cloud. Kevin McLaughlin explores what capacity management looks like in the cloud, which old concepts still apply, which should be retired, and what new metrics become important in the process. Kevin also covers the importance of performance management and outlines what needs to be monitored as workloads transition to the cloud and what to monitor once a workload is fully in the cloud, as well as considerations for ensuring the legacy environment maintains sufficient capacity during the transition. (see more details HERE (http://www.trub.in/2016/08/cmg-impact-and-velocity-conferences.html)

Tuesday, November 28, 2017

Alex Gilgur (#Facebook) and Kevin Mobley(#CMGnews) talk about the evolution of the #PerformanceMeasurement Industry

Monday, November 20, 2017

Announcing the CMG Performance and Capacity #Hackathon WINNERS -#CMGnews

Friday, November 17, 2017

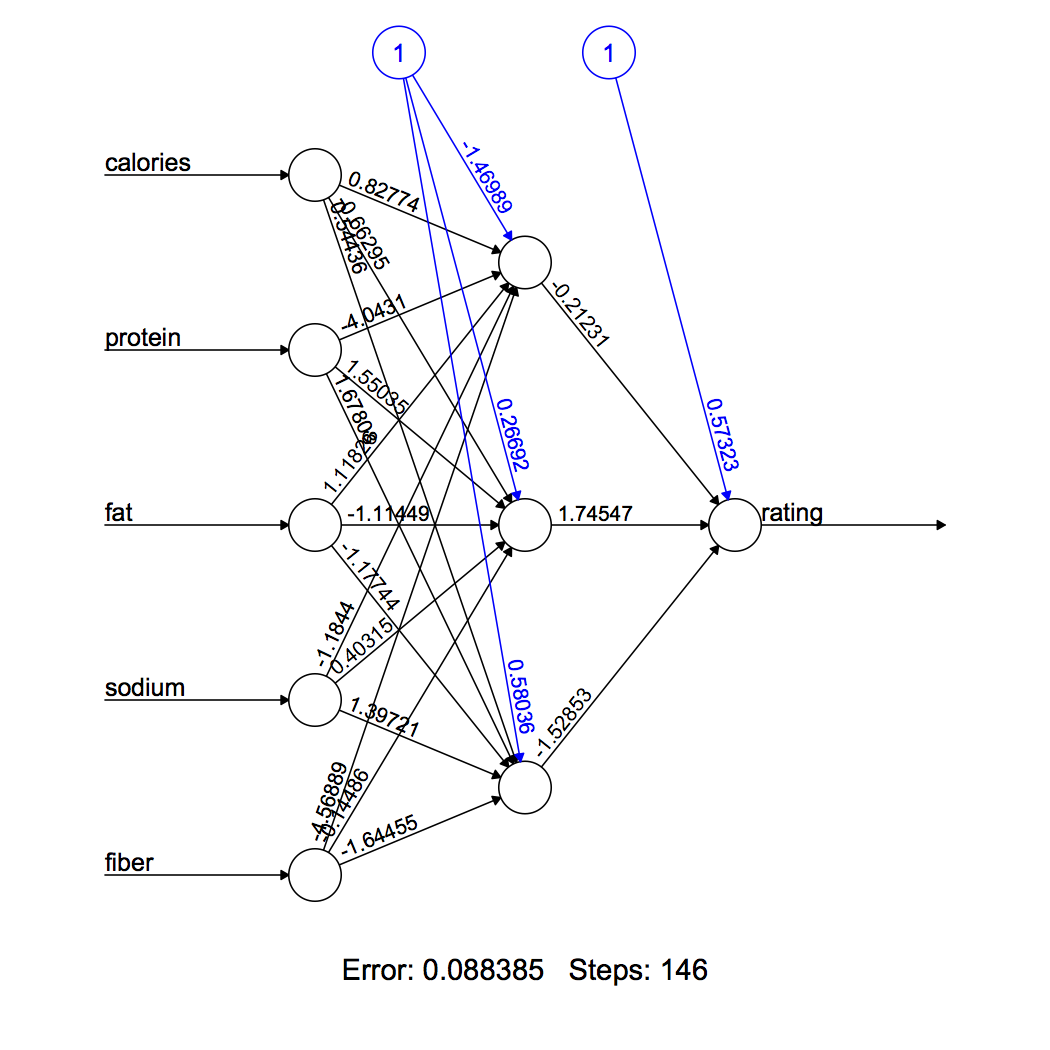
Creating & Visualizing Neural Network in R - Very good example

                                                          SOURCE of the Article


https://www.analyticsvidhya.com/blog/2017/09/creating-visualizing-neural-network-in-r/

Friday, November 3, 2017

The 1st DC area CMG meeting: Capacity Management on Cloud vs. on-Prem

PLEASE SEE DETAILS HERE and consider to attend!
____________________________

WHERE: “IBM Washington Systems Center”, 470 Springpark Place, Herndon, Va. 20170

WHEN:  6 of December 2017, 11AM-3PM 

WHAT and WHO:  Preliminary agenda

- LUNCH is provided by Talend.com

- Confirmed presentations:

1. Is Capacity Management Needed in the Cloud? - Kevin McLaughlin (https://cmgimpact.com/speakers/kevin-mclaughlin/) Capital One director (he will repeat his Velocity and CMG imPACT’17 conferences presentation)

Abstract: The cloud holds the promise of bottomless capacity, available instantly. Recently, Capital One has been shifting a significant portion of its workload to the public cloud. Kevin McLaughlin explores what capacity management looks like in the cloud, which old concepts still apply, which should be retired, and what new metrics become important in the process. Kevin also covers the importance of performance management and outlines what needs to be monitored as workloads transition to the cloud and what to monitor once a workload is fully in the cloud, as well as considerations for ensuring the legacy environment maintains sufficient capacity during the transition. (see more details HERE (http://www.trub.in/2016/08/cmg-impact-and-velocity-conferences.html))

Presenter bio: Kevin McLaughlin has 15 years of experience in financial services technology, primarily in roles related to capacity and performance management. Kevin spent eight years on the business side of banking, where he held various analytic roles including management of Capital One's statistical model governance process. He currently serves as the director of Capital One's technology capacity management team and still serves as a model risk officer for the bank's analytic models. Kevin has a BS in ag economics from Virginia Tech and an MBA with a concentration in MIS from George Mason University.

2. Capacity Planning for Pervasive Encryption with zBNA - Kathy Walsh, IBM Distinguished Engineer

Abstract: This session will discuss the capacity planning methods and tools available to gain a better understanding of the impact of a pervasive encryption implementation strategy. The session will discuss the system requirements necessary to build a capacity plan and will review the steps necessary to complete the planning. Information on both DFSMS data set encryption and CF
structure encryption will be shared. The capability to estimate the capacity impact on current and future technology such as a z14 processor will be covered.

3. Sponsor presentation from www.Talend.com (tentatively)


Thursday, October 19, 2017

What is TLS 1.3 - #CMGnews

Friday, October 13, 2017

The Seven Deadly Sins of AI Predictions (7 смертных грехов предсказаний об искусственном интеллекте)

Monday, October 2, 2017

Near-realtime Anomaly Detection by IT Control Charting - the case shown on my 1st Vimeo video

Wednesday, September 27, 2017

I am nominated (and now ELECTED) again for CMG 2018/2019 #BoardOfDirectors - #CMGnews

October 2017 update: I have been elected on the next 2 years term.
_____
I have been working as the director for CMG for almost 2 years.
Sitting on the Board of Directors (www.CMG.org)

Here is my previous nomination statement:

CMG Board of Directors Nomination


My term in CMG BOD comes to the end soon and the work was very interesting and exciting!
So I decided to nominate myself for the next term as I believe after gathering so great experiences as a CMG director now I can serve much more productive!

Below is my updated nomination statement:
Professional Work Experience: I have over 30 years of experience in the IT field. I have started my career in 1979 as an IBM 370 system engineer. In 1986, I received my PhD. in Robotics at St. Petersburg Technical University (Russia), where I then taught full-time such subjects as CAD/CAM, Robotics and Computer Science for about 12 years. For that period, I have published more than 30 papers and made several presentations for different international conferences related to the Robotics, Artificial Intelligence and Computer fields. In 1999, I moved to the US and worked at Capital One bank as a Capacity Planner. My first CMG paper was written and presented in 2001. The next one, "Global and Application Level Exception Detection System Based on MASF Technique," won a Best Paper award at CMG’02 and was presented again at UKCMG’03 in Oxford, England. My CMG papers were republished in the IBM z/Series Expo and in CIS Jornal. I also presented my papers in Central Europe CMG conference (Austria) and at numerous US regional meetings including workshops. After working more than 2 years as the Capacity Management team lead for IBM, I had worked for SunTrust Bank for 3 years and then got back to IBM holding for 2+ years Sr. IT Architect position (Certified IT Specialist). Currently I work for Capital One bank as IT Manager for IT Capacity Management group.
Major accomplishments: SETDS ML Anomaly detection methodology; Model Factory (patent pending). The current list of my publications consists of 14 items. I have an entrepreneurship experience as I have recently formed my small business for developing cloud based mobile apps and services (TRUTECH development, LLC)
Since 2005 I have worked as SouthernCMG vice-chair covering vendors’ connections.
In 2015 I have been elected to the CMG (http://www.cmg.org) board of directors. Major achievements as a CMG Director are: working in publication committee I have prototyped and put into CMG.org  site the CMG blog and published there a few initial posts; I was the MeasureIT editor and also helped to reestablish CMG journal. Found Suggested some good invited speakers for conference (e.g. Kevin McLaughlin from Capital One); brought 4 vendors as potential partners and also work in CMG regions committee. Has started organizing the DC area CMG meet-up (former NCACMG)

Willingness to Serve: CMG has been an extremely valuable part of my professional life for the past 15th years. Because of CMG, I became a known specialist in IT Capacity Management discipline! I have already worked at the regional CMG  level to support the organization and would like to serve on CMG's Board of Directors to continue promoting the organization throughout the IT community. My company and family members support my involvement with and commitment to CMG.

Candidate Statement: I believe that I am uniquely qualified and motivated to serve CMG and its future development, as the IT landscape dramatically changes. As my major accomplishment lays in the area of Machine Learning, Predictive analytics and Anomaly detection (e.g. SETDS method) I would like to be sure that CMG content reflects this and other bleeding edge technology including cloud computing and big data. Being experienced blogger/vlogger (System Management by Exception/ iTrubin on YouTube), I would leverage social networks to bring more members to CMG. Also I would like to leverage my success in establishing the vendors’ connection to bring more partners and sponsors. So my position as a Capacity Management expert and my dedication to the CMG organization will allow me to contribute in substantial ways. I further believe that my teaching experience could enhance CMG’s training and educational services for technical community. If elected, I will diligently pursue innovative ways to strengthen the organization’s membership. I will continue the CMG’s dedicated tradition of volunteerism and will actively seek ways to support and improve CMG's commitment to supporting its members.

ME: 


Monday, September 18, 2017

Note 8 vs S8 Speed Test. You won't believe this!!


Friday, September 15, 2017

I invite you to register for the #cmgimPACt conference and save 15%!

Dear Friends,
Hope you are well! As you know I am a part of the Board of Directors for Computer Measurement Group (CMG). This November we are hosting our 43rd annual imPACt conference November 6th-9th in New Orleans, Louisiana.
I think that this conference – which will host a variety of speakers from companies such as Netflix and Capital One – is something you should consider participating in. The networking and knowledge exchange opportunities are plentiful, and it should be a good time as well!
My friends and colleagues can register for the conference and save 15% using the code CMGBOD during the registration process.
I hope to see you there!
www.cmgimpact.com for more information


Rich Galan of Rubicon Project: The Need for Real-Time Anomaly Detection


Thursday, September 7, 2017

#imPACt 2017 conference program is published. 4. "Applying Artificial Intelligence for Performance Engineering" (#CMGnews)

See the full program HERE

 Applying Artificial Intelligence for Performance Engineering 
EMT
Environments become very complex thanks to new technology and architectures. Change happens more rapidly. Performance Engineering is either part of the pipeline or happens in production. This work cant be done by looking at static dashboards any longer and drawing conclusions based on years of experience. Performance Engineering has to leverage new approaches such as anomaly detection, machine learning and artificial intelligence. In this session I talk about how Dynatrace leverages AI to scale and automate many of the performance engineering tasks
Presenter bio: Andreas has been working in software quality for the past 15 years helping companies from small startup to large enterprise figuring out why their current application falls short on quality and how to prevent quality issues for future development. He is a regular speaker at international conferences, meetups & user groups. He has done DevOps Boston, Velocity Santa Clara, Agile Testing Days, Star West or STPCon in the recent years. Besides being excited about software quality he is also an enthusiastic salsa dancer
Andreas Grabner

Monday, August 28, 2017

#imPACt 2017 conference program is published. 3. "Rules of Thumb for Response Time Percentiles" (#CMGnews):

See the full program HERE


Again Percentiles! My anomaly detection tool (SonR) now has option to use percentiles to calculate UCL and LCL (Control Limits).


Let's go a listen about  percentiles at the following CMG international conference session:
 Rules of Thumb for Response Time Percentiles: How Risky are they? 
PERF
Whether externally mandated or internally tracked, the enterprise relies on governance of application service response time objectives. In many cases, achieving service requirements in terms of the average response time may not deliver an experience that delights the consumer. The consumer may request a deeper level of governance. Service providers want to achieve the promised objectives and, on the other hand, avoid over-provisioning. This paper explores rules of thumb that can be applied to estimate 90th or 95th percentiles for service response times, based on the measured or predicted mean. The risk assessment behind these recommendations is described in the paper. Various types of networks were modeled and analyzed. Even though classical queueing models rely on strict assumptions (and rarely met in the real world), it was found that the classical M/M/1 model provided a useful upper bound. Another function was evaluated for tighter accuracy.
Presenter bio: Dr. Salsburg is an independent consultant. Previously, Dr. Salsburg was a Distinguished Engineer and Chief Architect for Unisys Technology Products. He was founder and president of Performance & Modeling, Inc. Dr. Salsburg has been awarded three international patents in the area of infrastructure performance modeling algorithms and software. In addition, he has published over 70 papers and has lectured world-wide on the topics of Real-Time Infrastructure, Cloud Computing and Infrastructure Optimization. In 2010, the Computer Measurement Group awarded Dr. Salsburg the A. A. Michelson Award.
Presenter bio: Co-founder and Chief Scientist, BGS Systems, 1975 - 1998

#imPACt 2017 conference program is published. 2. "The Curse of P90..." (#CMGnews):

See the full program HERE

I love Percentiles! My anomaly detection tool (SonR) now has option to use percentiles to calculate UCL and LCL (Control Limits).

Let's go a listen about  percentiles at the following CMG international conference session:

The Curse of P90: An Elegant Way to Overcome it Without Magic 
CAP
Over the decades of development of methodologies and metrics for IT capacity planning and performance analysis, percentile terminology has become the lingua franca of the field. It makes sense: percentiles are easy to interpret, not sensitive to outliers, and directly usable for approximating the distribution of the variable being measured for stochastic simulations. However, depending on which percentile is used, we can miss important information, like multimodality of the metric's distribution. Another, less obvious, downside of relying on percentiles comes into play when we size infrastructure for a high percentile of demand (e.g., p90). Given that it takes time to order, manufacture, receive, and install infrastructure, this means that we need to answer the statistically nontrivial question, "what will this percentile of demand be in one to three years?" This paper discusses the issues that arise in answering it and proposes an elegant way of resolving them.
Presenter bio: Alexander Gilgur is a Data Scientist and Systems Analyst with over 20 years of experience in a wide variety of domains - Control Systems, Chemical Industry, Aviation, Semiconductor manufacturing, Information Technologies, and Networking - and a solid track record of implementing his innovations in production. He has authored and co-authored a number of know-hows, publications, and patents. Alex enjoys applying the beauty of Math and Statistics to solving capacity and performance problems and is interested in non-stationary processes, which make the core of IT problems today. Presently, he is a Network Data Scientist at Facebook and an occasional faculty member at UC Berkeley's MIDS program. He is also a father, a husband, a skier, a soccer player, a sport psychologist, a licensed soccer coach, a licensed professional engineer (PE), and a music aficionado. Alex's technical blog is at http://alexonsimanddata.blogspot.com.


#imPACt 2017 conference program is published. Best Paper CMG India: Performance #AnomalyDetection & Forecasting Model (#CMGnews)


See the full program HERE

Performance Anomaly Detection & Forecasting Model (PADFM) for eRetailer Web application 
EMT
With high performance becoming a mandate, its impact & need for sophisticated performance management is realized by every e-business. Though Application Performance Management (APM) tools has brought down the performance problem diagnosis time to a great extend, these tools don't actually help in detecting the anomalies in the production environment (online or offline mode) and make forecasts on the server performance metrics for capacity sizing. Hence, robust performance anomaly detection and forecasting solution is in demand to detect anomalies in production environment and to provide forecasts on server resource demand to support in server sizing. This paper deals with the implementation of Performance Anomaly detection and Forecasting Model for an online retailer business application using statistical modeling & machine learning techniques that has yielded multi-fold benefit to the business
Presenter bio: I carry about 14+ years of industry wide experience in Performance Testing & Performance Engineering. Am a computer science engineer with Masters in Software Systems (MS) from BITS PILANI, India. I am the Co-Founder & CTO of a US startup, QAEliteSouls LLC (http://qaelitesouls.com) and the founder of a Indian startup, EliteSouls Consulting Services LLP (http://elitesouls.in). I am the CMG India Director for the year 2017.

Cloud Performance Management and Machine Learning are Covered by Greater Boston CMG fall 2017 conference (#CMGnews)

See full agenda HERE

Date and TimeFriday, September 22, 2017, 8:30am - 5:00pm

10:00Performance Management for Cloud Applications (1)Priyanka Arora (MUFG APM)
11:00Benchmarking Machine Learning (2)Rohith Bakkannagari (Mathworks)
2:00Dynatrace journey from monolithic application to Cloud native application (4)Asad Ali (Dynatrace)
3:00Can a robot read your performance reports? Deep learning and machine learning for Performance and Capacity Engineers (5)Anoush Najarian (Mathworks)

Monday, August 14, 2017

I will present at #imPACt2017 conference - "The Model Factory - Correlating Server and Database Utilization with Customer Activity"

The abstract and more info can be found here:

US Patent "SYSTEMS AND METHODS FOR MODELING COMPUTER RESOURCE METRICS", I Trubin et al


Presentation is scheduled:
New Orleans, Louisiana at the 
Loews New Orleans Hotel
Session Number:  362
Subject Area:  CAP
Session Date and Time: 11/8/2017, 2:20 PM-2:50 PM
Room Assignment:  Beauregard

See conference details here: http://cmgimpact.com/ 
Your are welcome to attend!

Thursday, July 27, 2017

Igor = I go R. I have redeveloped SETDS on R = SonR

The 1st attempt to go from SAS to R:

- R script to run in SAS: one more way to built IT-Control Chart


The 1st attempt of SEDS Control Charts to be built using R: 


My proposal to build SETDS on any open-source platforms (including R):

Using RODBC package against MySQL data to build SEDS control charts:


SETDS is actually a 2-level (1. exception and 2. trend detection)  machine learning based anomaly detection method. It competes with other anomaly detection methods that are more and more getting implemented on R:

Finally SETDS was implemented on R and named SonR.

Saturday, July 22, 2017

All the performance solutions you need, in one conference #imPACt #CMGnews

Friday, July 14, 2017

10 years anniversary of running my tech blog - 212th post. SUBSCRIBE!

Time flies. 10 years ago in June 2007 I wrote: 

"To keep the discussion about how to Manage computer Systems by Exception (e.g. by  using SPC, APC, MASF, 6-SIGMA, SETDS and other techniques), I run this blog and also publish/present white papers at the www.CMG.org. ..."


And now I am posting the 212 th post... All in all that makes my dream to publish a monographic book came true and I happy that my "virtual" on-line "book" is visited ~135,000 times: 


You can see the history has ups and downs following my career path. Still plan to keep posting....

Thank you for viewing!


Thursday, June 29, 2017

My CMG'05 papers was cited in PhD Thesis "Finding External Indicators of Load on a Web Server via Analysis of Black-Box Performance Measurements"

Author:
  from  MarkLogic Corporation
Thesis for: PhD, Advisor: Dr. Alva Couch

ABSTRACT:

Traditional methods for system performance analysis have long relied on a mix of queuing theory, detailed system knowledge, intuition, and trial-and-error. These approaches often require construction of incomplete gray-box models that can be costly to build and difficult to scale or generalize. In this thesis, we present a black-box analysis method to discover the amount of load on a web server with minimal knowledge of its internal mechanisms. In contrast to white-box analysis, where a system's internal mechanisms can help to explain its behavior, black-box analysis relies on external measurements of a system's reactions to well-understood inputs. The primary advantages of black-box analysis are its relative independence from specific architectures,its applicability to opaque environments (e.g., closed-source systems), and its scalability. In this thesis, we show that statistical analyses of web server response times can be used to discover which server resources are stressed by particular workloads. We also show that under certain conditions, the settling period of server response times after resource perturbation correlates positively with the degree of perturbation. Finally, we use the two-sample Kolmogorov-Smirnov (KS) test to measure statistical equality of multiple samples drawn from response times of a server under various steady-state load conditions. We show that in specific circumstances, the number of samples that test as statistically equal can serve as an imprecise indicator of the amount of load on a server. All of these contributions will aid performance analysis in new environments such as cloud computing, where internal server mechanisms and configurations change dynamically and structural information is hidden from users.

Finding External Indicators of Load on a Web Server via Analysis of Black-Box Performance Measurements. Available from: https://www.researchgate.net/publication/230707525_Finding_External_Indicators_of_Load_on_a_Web_Server_via_Analysis_of_Black-Box_Performance_Measurements [accessed Jun 29, 2017].

Cited:  CMG'2005  paper:


Friday, June 16, 2017

The #DynamicThreshold is common art by now...

I have got the following feedback on the previous post about some capacity management tool from one of the this blog posts author: 

"As far as any similarity to my own work, I think my methods for dynamic thresholds are common art by now… and most certainly derived from Igor’s own presentations that I attended 😊"

So I am proud of making  some influence!

Tuesday, June 6, 2017

Re-posting #CMGamplify - "#DataScience Tools for Infrastructure Operational Intelligence"

The following  CMG Amplify blog post written by Tim Browning is interesting as it underlines what this "System Management by Exception" blog is always about:

"...In order for the performance analyst to attend to troubled systems that may number in the thousands, it is imperative that we filter out of this vast ocean of time series metrics only those events that are anomalous and/or troubling to operational stability. It is too overwhelming to sit and look at thousands of hourly charts and tables. In addition, there is a need for continuous monitoring capability that detects problems immediately or, better yet, predicts them in the near term.  Increasingly, we need self-managing systems that learn and adapt to complex continuous activities and quickly identify the causal reconstruction of threatening conditions as well as recommend solutions (or even automatically deploy remediation events).  Out of necessity, this is where we are heading..."

and in order to  achieve that:

"..In data mining, anomaly detection (also known as outlier detection) is the search for data items in a dataset which do not conform to an expected pattern. Anomalies are also referred to as outliers, change, deviation, surprise, aberrant, peculiarity, intrusion, etc. Most performance problems are anomalies. Probably the most successful techniques (so far) would be Multivariate Adaptive Statistical Filtering (MASF) for detecting statistically extreme conditions and Relative Entropy Monitoring for detecting unusual changes in patterns of activity..."

See entire post here: https://www.cmg.org/2017/06/data-science-tools-infrastructure-operational-intelligence/


Wednesday, May 17, 2017

Eli Hizkiyev: ConicIT – Ground Breaking Technology Unleashed. Sense and Respond? Why Not Predict and Prevent?

ConicIT Summary

Take your existing performance monitoring environment to the next level. ConicIT, a software solution, reads thousands of performance and stability metrics per minute from your performance monitors such as TMON, Omegamon, Mainview, Sysview and others. ConicIT processes and analyzes these metrics with machine learning technology and automatically generates alerts about problems in which even seasoned, professional performance staff may not notice if they look at the same data.

Beyond the automatic analytics and alerts, ConicIT provides an efficient and friendly web-interface which allows you to browse through relevant performance data, in an aggregated way, including watching values and graphs from the very moment a problem occurs. With ConicIT in place, you won’t need to tediously jump between many different monitors or screens. ConicIT aggregates the data from different sources into single view, so you can watch the data easily receiving either high-level or low-level insights into your application performance.

ConicIT also creates important calculated variables. Examples include ratios, summaries, and critical information such as taking the cumulating CPU-time of a job or transaction and calculating the real-time CPU consumption of jobs and transactions. Much of this information is missing from all monitors. The real-time CPU consumption is calculated using the rate in which the CPU-Time rises during each minute.

One of the major advantages of ConicIT is the dynamic alerts which are based on machine learning and statistical algorithms. Traditional monitors offer simple static-alerts based on thresholds. But static alerts are always coming too late and most of them are false-alerts. ConicIT solves this problem with its advanced algorithms. ConicIT automatically studies the typical behavior of each metric every day of the week and every hour of the day. So ConicIT knows (and shows you) the expected range for each performance metric. ConicIT also learns how stable each variable is and how often and how long it may be out of its normal range. Based on this analysis, ConicIT recognizes when there is an anomaly in the system in one or more metrics. In such case ConicIT will send you an alert with information and graphs about the problem. These proactive alerts come much earlier and more accurately than any static-alert type performance system. ConicIT gives you time to solve problems before they affect your end-users, clients and customers.

The combination of early proactive-alerts when the problem started, along with supportive information and graphs, allows you and your team to quickly pinpoint where the problem started and which team should work on resolving it. Thus, ConicIT reduces the required war-rooms for fixing problems and reduces the mean time for repairing problems.

Figure 1: 30 hours graph


Figure 2: It takes a single click (on the left menu) to switch and view any type of information from any point in time

Tuesday, May 9, 2017

Re-posting CMG blog posts: Lifting the Cloud of Obscurity from your Cloud Deployment - #cmgnews

Wednesday, May 3, 2017

The effect of outliers on statistical properties - Anscombe's quartet

Anscombe's quartet comprises four datasets that have nearly identical simple descriptive statistics, yet appear very different when graphed. Each dataset consists of eleven (x,y) points. They were constructed in 1973 by the statistician Francis Anscombe to demonstrate both the importance of graphing data before analyzing it and the effect of outliers on statistical properties. He described the article as being intended to attack the impression among statisticians that "numerical calculations are exact, but graphs are rough."[1]

Source: https://en.wikipedia.org/wiki/Anscombe%27s_quartet


(You can easily check this in R by loading the data with data(anscombe).) But what you might not realize is that it's possible to generate bivariate data with a given mean, median, and correlation in any shape you like — even a dinosaur:


Source: The Datasaurus Dozen
Posted: 02 May 2017 08:16 AM PDT
(This article was first published on Revolutions, and kindly contributed to R-bloggers)

Reposting CMG blog posts. imPACt 2017 – What to do in New Orleans (#CMGnews)

Do you plan to attend this year imPACt conference? I do and I am glad it will be in New Orleans!
_______________
Founded by the French, ruled by the Spanish, and bought by the US…New Orleans is known for its distinct Creole culture, Jazz, Mardi Gras and many other attributes that give this city a powerful sense of identity.  So, what do you do beyond attending technical sessions?
In upcoming posts we’ll share a few ideas with you.  To get you started, here’s a few museums that may be of interest.
  • The National World War II Museum: The museum tells the story of the American Experience in the war that changed the world (#4 on TripAdvisor Top 10 list of museums in the USA)
  • New Orleans Historic Voodoo Museum:  Well, of course you’re going to find a voodoo museum in NOLA…how could you not?
  • New Orleans Pharmacy Museum:  This does make sense…Louisiana is the birthplace of modern pharmacy and New Orleans resident, Louis Dufilho, was America’s first licensed pharmacist.

Monday, May 1, 2017

The 8th ACM/SPEC on International Conference on Performance Engineering: MASF and Control charts


ICPE '17  - conference site.

The following paper has a nice summary of how I use MASF and Control charts and then it has a proposition of similar but improved ...

Technique for Detecting Early-Warning Signals of Performance Deterioration in Large Scale Software Systems
Raghu Ramakrishnan † Tata Consultancy Services Noida, UP, INDIA
Arvinder Kaur † USICT, Guru Gobind Singh Indraprastha University Dwarka, Delhi, INDIA

ABSTRACT The detection of early-warning signals of performance deterioration can help technical support teams in taking swift remedial actions, thus ensuring rigor in production support operations of large scale software systems. Performance anomalies or deterioration, if left unattended, often result in system slowness and unavailability. In this paper, we presents a simple, intuitive and low-overhead technique for recognizing the early warning signs in near real time before they impact the system The technique is based on the inverse relationship which exists between throughput and average response time in a closed system. Because of this relationship, a significant increase in the average system response time causes an abrupt fall in system throughput. To identify such occurrences automatically, Individuals and Moving Range (XmR) control charts are used. We also provide a case study from a real-world production system, in which the technique has been successfully used. The use of this technique has reduced the occurrence of performance related incidents significantly in our daily operations. The technique is tool agnostic and can also be easily implemented in popular system monitoring tools by building custom extensions. 

".....The use of control charts, MASF and its variations for monitoring software systems was proposed by Trubin et al. [24][25][26][27]. MASF partitions the time during which the system is operational, into hourly, daily or weekly reference segments to characterize repeatable or similar workload behavior experienced by a software system [8]. For example, the workload encountered by the system on Monday between 9:00 a.m. - 10:00 a.m. may be different from the workload between 10:00 a.m. - 11:00 a.m. Each segment is characterized by its mean and standard deviation. The number of reference sets can be further reduced using clustering techniques. The upper and lower limits are established for each reference at three standard deviations from the mean..."

[24] I. Trubin. Review of IT Control Chart. Journal of Emerging Trends in Computing and Information Sciences, 4(11):857–868, Dec. 2013.
[25] I. Trubin and V. C. Scmg. Capturing workload pathology by statistical exception detection system. In Proceedings of the Computer Measurement Group, 2005. 
[26] I. A. Trubin. Global and Application Level Exception Detection System, Based on MASF Technique. In 28th International Computer Measurement Group Conference, December 8-13, 2002, Reno, Nevada, USA, Proceedings, pages 557–566, 2002. 
[27] I. A. Trubin and L. Merritt. ”Mainframe Global and Workload Level Statistical Exception Detection System, Based on MASF”. In 30th International Computer Measurement Group Conference, December 5-10, 2004, Las Vegas, Nevada, USA, Proceedings, pages 671–678, 2004.

Full text: http://dl.acm.org/citation.cfm?id=3044533  

Monday, April 10, 2017

CMG BLOG is on production now!

CMG Amplify - new blog about Capacity and Performance