Re-posting my Facebook friend:
Sunday, October 6, 2013
Forget cloud computing... Soon we will be lost in FOG COMPUTING!
Re-posting my Facebook friend:


 Igor Trubin began his engineering career in 1979 as an IBM/370 systems engineer. He earned a Ph.D. in Robotics from St. Petersburg Technical University in 1986 and spent 12 years there as a professor teaching CAD/CAM and Robotics. He has published and presented more than 60 technical papers and conference presentations in robotics, artificial intelligence, IT performance, capacity management, anomaly detection, and FinOps. After moving to the U.S. in 1999, Igor worked at Capital One, IBM, and SunTrust Bank in senior engineering, architecture, and management roles. His 2002 CMG paper on exception detection received a Best Paper Award. He later developed Perfomalist.com, based on his original methods for anomaly, change-point, and trend detection, and created the online course “Performance Anomaly Detection.” At Capital One, he led development of cloud capacity-management and FinOps solutions, including the award-winning OptiCloud application. He has served on the CMG Board of Directors since 2015. Now semi-retired, Igor focuses on research, writing, and consulting. His current work expands his concept of the “Area of Normal Functioning” (ANF) from technical systems to human, orga
Thursday, October 3, 2013
I have introduced the SETDS methodology to the following IT organizations.
The SETDS (Statistical Exception & Trend Detection) idea was born in Capital One, and was first published in 2001 in my first www.CMG.org white paper:
Then for the last 12 years during some projects participation I have introduced and in some cases partially implemented SETDS methodology for the following Companies:
- IBM,
- SunTrust,
- Coca Cola,
- WellPoint,
- ING,
- JP Morgan Chase,
- State Farm
- IBM,
- SunTrust,
- Coca Cola,
- WellPoint,
- ING,
- JP Morgan Chase,
- State Farm
Igor Trubin began his engineering career in 1979 as an IBM/370 systems engineer. He earned a Ph.D. in Robotics from St. Petersburg Technical University in 1986 and spent 12 years there as a professor teaching CAD/CAM and Robotics. He has published and presented more than 60 technical papers and conference presentations in robotics, artificial intelligence, IT performance, capacity management, anomaly detection, and FinOps. After moving to the U.S. in 1999, Igor worked at Capital One, IBM, and SunTrust Bank in senior engineering, architecture, and management roles. His 2002 CMG paper on exception detection received a Best Paper Award. He later developed Perfomalist.com, based on his original methods for anomaly, change-point, and trend detection, and created the online course “Performance Anomaly Detection.” At Capital One, he led development of cloud capacity-management and FinOps solutions, including the award-winning OptiCloud application. He has served on the CMG Board of Directors since 2015. Now semi-retired, Igor focuses on research, writing, and consulting. His current work expands his concept of the “Area of Normal Functioning” (ANF) from technical systems to human, orga
Tuesday, September 17, 2013
Performance and Capacity 2013 by CMG.org - I GO!
I have just registered
and going to attend the CMG'13 international conference
(November 5th through 7th in La Jolla, CA).
Why?
BENEFITS: "...cloud solutions, virtualization, centralized and distributed systems covering performance analysis and capacity planning across operating systems, storage, and networking. The disciplines are applied at hardware resource, application service and business efficiency levels, including performance and capacity aspects of IT Service Management, Performance Testing and Application Performance Management..."

(November 5th through 7th in La Jolla, CA).
Why?
BENEFITS: "...cloud solutions, virtualization, centralized and distributed systems covering performance analysis and capacity planning across operating systems, storage, and networking. The disciplines are applied at hardware resource, application service and business efficiency levels, including performance and capacity aspects of IT Service Management, Performance Testing and Application Performance Management..."

See you there !
Igor Trubin began his engineering career in 1979 as an IBM/370 systems engineer. He earned a Ph.D. in Robotics from St. Petersburg Technical University in 1986 and spent 12 years there as a professor teaching CAD/CAM and Robotics. He has published and presented more than 60 technical papers and conference presentations in robotics, artificial intelligence, IT performance, capacity management, anomaly detection, and FinOps. After moving to the U.S. in 1999, Igor worked at Capital One, IBM, and SunTrust Bank in senior engineering, architecture, and management roles. His 2002 CMG paper on exception detection received a Best Paper Award. He later developed Perfomalist.com, based on his original methods for anomaly, change-point, and trend detection, and created the online course “Performance Anomaly Detection.” At Capital One, he led development of cloud capacity-management and FinOps solutions, including the award-winning OptiCloud application. He has served on the CMG Board of Directors since 2015. Now semi-retired, Igor focuses on research, writing, and consulting. His current work expands his concept of the “Area of Normal Functioning” (ANF) from technical systems to human, orga
Wednesday, September 11, 2013
CMG 2014/2015 Board of Directors Election - VOTE FOR ME!
Final update:
The COMPUTER MEASUREMENT GROUP (www.CMG.org) membership has elected me to serve as Director for the 2016 - 2017 term
2015 UPDATE: Thanks for all who voted for me last year! I am resubmitting my nomination gain for this year.
_______
I have recently updated my following post: CMG Board of Directors Nomination
because this year I am nominated. If you are CMG member, VOTE FOR ME!!!
The COMPUTER MEASUREMENT GROUP (www.CMG.org) membership has elected me to serve as Director for the 2016 - 2017 term
2015 UPDATE: Thanks for all who voted for me last year! I am resubmitting my nomination gain for this year._______
I have recently updated my following post: CMG Board of Directors Nomination
because this year I am nominated. If you are CMG member, VOTE FOR ME!!!
Voting in CMG's annual election is occurring now.
The voting deadline is this Friday, September 13. Please take part in shaping
CMG's future by voting.
To vote, go to CMG's website. Click on "Members Center Login" in the top right of the screen. (If you don't know your password
you can request that it be sent to you) Next, click on CMG 2014 Board of
Directors Election and the rest is self-explanatory.
Please do this now. Lots of things are going on in
CMG and your vote counts!
THANK YOU!
Igor Trubin began his engineering career in 1979 as an IBM/370 systems engineer. He earned a Ph.D. in Robotics from St. Petersburg Technical University in 1986 and spent 12 years there as a professor teaching CAD/CAM and Robotics. He has published and presented more than 60 technical papers and conference presentations in robotics, artificial intelligence, IT performance, capacity management, anomaly detection, and FinOps. After moving to the U.S. in 1999, Igor worked at Capital One, IBM, and SunTrust Bank in senior engineering, architecture, and management roles. His 2002 CMG paper on exception detection received a Best Paper Award. He later developed Perfomalist.com, based on his original methods for anomaly, change-point, and trend detection, and created the online course “Performance Anomaly Detection.” At Capital One, he led development of cloud capacity-management and FinOps solutions, including the award-winning OptiCloud application. He has served on the CMG Board of Directors since 2015. Now semi-retired, Igor focuses on research, writing, and consulting. His current work expands his concept of the “Area of Normal Functioning” (ANF) from technical systems to human, orga
Saturday, June 8, 2013
No obvious thresholds for a metric? - Analyze EV meta-metric to capture saturation point!
Some data (metrics) does not have obvious thresholds. For instance, overall disk I/O rate for a server. You have to analyze each particular disk to find some hotspots using I/O rate in conjunction with the disk busy metric, but it is very intensive work which is hard to automate. How to do that I explained in my CMG’03 paper “Disk Subsystem Capacity Management, Based on Business Drivers, I/O Performance Metrics and MASF”.
In that paper I also suggested to use Control Limits as a Dynamic Threshold. Plus I suggested to collect and analyses EV meta-metric called there the “Extra IOs” becouse for I/O rate parent metric the EV (Exception Value) has physical meaning (additional and unusual number of I/Os system processed).

EV meta-metric behaves like 1st derivative of the parent metric. If metric stays constant (between limits) EV=0; If it linearly grows, EV=CONSTANT>0. If it linearly goes down, EV=-CONSTANT<0 and="" on.="" so="">
That fact can help to identify automatically some important patterns in the data history using very simple and universal threshold EV=0. Analyzing the EV trend even could help to predict some future states of the system.
If EV is positive and then got mostly zero that could be indication of the saturation. And the suturation usualy indicates some capacity issue.
If EV was mostly zero and started to be positive that could be indication of the trend beginning.
To illustrate that I am useing the population growth (logistic) curve to simulate some trend starting and the saturation point reaching as that curve naturaly has both pints (S-curve).

Plus I have randomized that curve by adding some random component to simulate a volatility. See in the picture how EV behaves indicating both events:

Of couse the experienced analyst can see just eyeballing when the saturation started, but in the "big data" era we have to deal with dozens thousends systems so we got to automate this type of patterns capture!
And EV could help.
Igor Trubin began his engineering career in 1979 as an IBM/370 systems engineer. He earned a Ph.D. in Robotics from St. Petersburg Technical University in 1986 and spent 12 years there as a professor teaching CAD/CAM and Robotics. He has published and presented more than 60 technical papers and conference presentations in robotics, artificial intelligence, IT performance, capacity management, anomaly detection, and FinOps. After moving to the U.S. in 1999, Igor worked at Capital One, IBM, and SunTrust Bank in senior engineering, architecture, and management roles. His 2002 CMG paper on exception detection received a Best Paper Award. He later developed Perfomalist.com, based on his original methods for anomaly, change-point, and trend detection, and created the online course “Performance Anomaly Detection.” At Capital One, he led development of cloud capacity-management and FinOps solutions, including the award-winning OptiCloud application. He has served on the CMG Board of Directors since 2015. Now semi-retired, Igor focuses on research, writing, and consulting. His current work expands his concept of the “Area of Normal Functioning” (ANF) from technical systems to human, orga
Thursday, May 30, 2013
CMG papers: Knee detection vs. EV based trends detection (SETDS)
The CMG’12 paper “A Note on Knee Detection“ (J. Ferrandiz, A. Gilgur) presented a method of “system phase change” detection by using the piece‐wise linear model against data with any supply‐demand relationship, e.g. CPU vs. transactions, load vs. traffic.
The weakness of the approach is the following underlying assumption in the methodology: the most of the data points are in the low load region. But all in all that is a relatively simple and effective way to capture the fact of constantly exceeding some threshold (confidence level e.g. 95%) of the data beyond detecting “knee”.
I see some similarity in my method of detecting the system phase changes (trends detection implemented by SETDS).
Based on my paper CMG'08 “Exception based Modeling and Forecasting” I use EV (Exception Value) meta-metric to detect pattern change in the data. The phases in the data should be separated by roots of the EV = 0 equation because for EV > 0 the data mostly exceeds the upper control limit and for EV < 0 – it is mostly below low control limit, and data is stable where EV=0.
But I used my way only for time series data (EV= f(t)), so detected phases are separated by points in time. Is that possible to apply my EV based approach to non-time series data? Not sure. But knowing that EV is just the deference between actual data and control limits (e.g. percentile based), the above mentioned knee detection algorithm could be a some kind of EV- based approach applied to non-time series data…
And I believe EV based approach is free from the assumption that the data should be somewhat misbalanced and it can also detect multiple “knees” with both directions (up and down). Only one caviar still exists (the same with knee detection algorithm): too many phases detecting, but that could be tuned by limits change, e.g. from 95 percentile to 99 and by grouping data (like aggregating minutes to hours for time-series data).

The weakness of the approach is the following underlying assumption in the methodology: the most of the data points are in the low load region. But all in all that is a relatively simple and effective way to capture the fact of constantly exceeding some threshold (confidence level e.g. 95%) of the data beyond detecting “knee”.
I see some similarity in my method of detecting the system phase changes (trends detection implemented by SETDS).
Based on my paper CMG'08 “Exception based Modeling and Forecasting” I use EV (Exception Value) meta-metric to detect pattern change in the data. The phases in the data should be separated by roots of the EV = 0 equation because for EV > 0 the data mostly exceeds the upper control limit and for EV < 0 – it is mostly below low control limit, and data is stable where EV=0.
But I used my way only for time series data (EV= f(t)), so detected phases are separated by points in time. Is that possible to apply my EV based approach to non-time series data? Not sure. But knowing that EV is just the deference between actual data and control limits (e.g. percentile based), the above mentioned knee detection algorithm could be a some kind of EV- based approach applied to non-time series data…
And I believe EV based approach is free from the assumption that the data should be somewhat misbalanced and it can also detect multiple “knees” with both directions (up and down). Only one caviar still exists (the same with knee detection algorithm): too many phases detecting, but that could be tuned by limits change, e.g. from 95 percentile to 99 and by grouping data (like aggregating minutes to hours for time-series data).
 Igor Trubin began his engineering career in 1979 as an IBM/370 systems engineer. He earned a Ph.D. in Robotics from St. Petersburg Technical University in 1986 and spent 12 years there as a professor teaching CAD/CAM and Robotics. He has published and presented more than 60 technical papers and conference presentations in robotics, artificial intelligence, IT performance, capacity management, anomaly detection, and FinOps. After moving to the U.S. in 1999, Igor worked at Capital One, IBM, and SunTrust Bank in senior engineering, architecture, and management roles. His 2002 CMG paper on exception detection received a Best Paper Award. He later developed Perfomalist.com, based on his original methods for anomaly, change-point, and trend detection, and created the online course “Performance Anomaly Detection.” At Capital One, he led development of cloud capacity-management and FinOps solutions, including the award-winning OptiCloud application. He has served on the CMG Board of Directors since 2015. Now semi-retired, Igor focuses on research, writing, and consulting. His current work expands his concept of the “Area of Normal Functioning” (ANF) from technical systems to human, orga
Tuesday, May 21, 2013
"Is your Capacity Available?" - A topic for CMG'13 Conference Paper
2016 UPDATE.Finaly the paper was written, presented and published www.CMG.org
Here is the presentation slides:
_____
Capacity Management and Availability Management are two interconnected services. That connection is getting more important in current era of virtualization, clustering and especially for cloud computing. It is obviously, that IT customers not only want the sufficient capacity for their applications, but even more importantly want that capacity highly available.

Here is the presentation slides:
_____
Capacity Management and Availability Management are two interconnected services. That connection is getting more important in current era of virtualization, clustering and especially for cloud computing. It is obviously, that IT customers not only want the sufficient capacity for their applications, but even more importantly want that capacity highly available.
I have to deal with that combination recently and firmly believe that could be a great topic for up-coming CMG'13 conference. I plan to attend the conference, but unfortunately in spite I have a topic, the title "Is your Capacity Available?" and some already published in this blog related materials, I do not have ability to write the paper for this year CMG conference.
May be somebody could pick that idea up and share your experience in this mix area of Capacity and Availability? I would be extremely happy!
Here is the list of my posts related to this subject:
BTW The last post has some suggestion to estimate each node (component) availability (which is needed for a cluster availability calculation) by just looking at the Incident records history and use MTTR from there. Why not? If you have a good Incident Management that could be a very cheap solution! I would suggest to calculate different degrees of estimated availability, such as "Absolute" availability estimation based on up-time completely free from any incidents. Or "N-degree availability" number if only severity <= N incidents are taken in account or filtering out only incidents related to a particular component capacity - "Capacity Availability". Sure if Incident Management service is not mature enough, that will provide incorrect input for estimation. So you may consider other mechanisms I mentioned in that post... But from other hand that would encourage you (maybe via CSI) to improve your Incident management service!
 Igor Trubin began his engineering career in 1979 as an IBM/370 systems engineer. He earned a Ph.D. in Robotics from St. Petersburg Technical University in 1986 and spent 12 years there as a professor teaching CAD/CAM and Robotics. He has published and presented more than 60 technical papers and conference presentations in robotics, artificial intelligence, IT performance, capacity management, anomaly detection, and FinOps. After moving to the U.S. in 1999, Igor worked at Capital One, IBM, and SunTrust Bank in senior engineering, architecture, and management roles. His 2002 CMG paper on exception detection received a Best Paper Award. He later developed Perfomalist.com, based on his original methods for anomaly, change-point, and trend detection, and created the online course “Performance Anomaly Detection.” At Capital One, he led development of cloud capacity-management and FinOps solutions, including the award-winning OptiCloud application. He has served on the CMG Board of Directors since 2015. Now semi-retired, Igor focuses on research, writing, and consulting. His current work expands his concept of the “Area of Normal Functioning” (ANF) from technical systems to human, orga
Tuesday, May 7, 2013
CMG'12: "Time‐Series: Forecasting + Regression"
I continue sharing my impressions about last 2012 year international www.CMG.org conference.
(see previous: HERE and HERE).
This post is about Alex Gilgur paper. First time I met Alex in CMG'06 conference and put some note of his 2006 paper HERE. We met at several other CMG conferences and we talked a lot, mixing high matters (philosophy, physics and math) with our Capacity Management needs.... One of that discussion expired him to write the following paper:
Time-Series: Forecasting + Regression: “And” or “Or”?
In the agenda announcement he mentioned that fact and I really appreciate it:
"At CMG’11, I had a fascinating discussion with Dr. I.Trubin. We talked about Uncertainty, Second Law of Thermodynamics, and other high matters in relation to IT. That discussion prompted this paper..."
Reading the paper I was impressed how he combined the trending analysis with the business driver data correlation technique. I do that quite often, one example was published in my CMG'12 paper as well and summary slide can be seen here:
:
(see previous: HERE and HERE).
This post is about Alex Gilgur paper. First time I met Alex in CMG'06 conference and put some note of his 2006 paper HERE. We met at several other CMG conferences and we talked a lot, mixing high matters (philosophy, physics and math) with our Capacity Management needs.... One of that discussion expired him to write the following paper:
Time-Series: Forecasting + Regression: “And” or “Or”?
In the agenda announcement he mentioned that fact and I really appreciate it:
"At CMG’11, I had a fascinating discussion with Dr. I.Trubin. We talked about Uncertainty, Second Law of Thermodynamics, and other high matters in relation to IT. That discussion prompted this paper..."
Reading the paper I was impressed how he combined the trending analysis with the business driver data correlation technique. I do that quite often, one example was published in my CMG'12 paper as well and summary slide can be seen here:
:

But in his work the technique is formed in a very elegant mathematical way and also he used Little’s Law to fight the most unpleasant statisticians rule: "Correlation Does Not Imply Causation".
In the next post I will put some comments about his another CMG'12 paper called:
"A Note on Knee Detection"
In the next post I will put some comments about his another CMG'12 paper called:
"A Note on Knee Detection"
Igor Trubin began his engineering career in 1979 as an IBM/370 systems engineer. He earned a Ph.D. in Robotics from St. Petersburg Technical University in 1986 and spent 12 years there as a professor teaching CAD/CAM and Robotics. He has published and presented more than 60 technical papers and conference presentations in robotics, artificial intelligence, IT performance, capacity management, anomaly detection, and FinOps. After moving to the U.S. in 1999, Igor worked at Capital One, IBM, and SunTrust Bank in senior engineering, architecture, and management roles. His 2002 CMG paper on exception detection received a Best Paper Award. He later developed Perfomalist.com, based on his original methods for anomaly, change-point, and trend detection, and created the online course “Performance Anomaly Detection.” At Capital One, he led development of cloud capacity-management and FinOps solutions, including the award-winning OptiCloud application. He has served on the CMG Board of Directors since 2015. Now semi-retired, Igor focuses on research, writing, and consulting. His current work expands his concept of the “Area of Normal Functioning” (ANF) from technical systems to human, orga
Friday, May 3, 2013
SCMG report: Business and Application Based Capacity Management
Another presentation at our April 2013 SCMG meeting was very interesting. Ann Dowling presented the result of large project she led to improve the capacity management of some big IT organization. Here is the title and the link:
Business and Application Based Capacity Management
Actually I was involved in that project too. I was at the beginning of the effort to build custom Cognos based reporting process. We tried to use BIRT reporting and then successfully switched to Cognos.
Interesting, that the presentation has mentioned “Dynamic thresholds”. I thought it is something like control charts do (and by the way during my work on that project I found "out-of-box" BIRT based control chart reports in the TCR and I suggested to use it or to build better ones using COGNOS), but looks like by “Dynamic thresholds” they mean “The ability to change (manually?) to meet customer department adjustments. The threshold metrics can be at the prompt page.”…
I prefer using that term for thresholds that a reporting system automatically changes based on a behavioral learning process.
Much later I have played with BIRT and COGNOS to build control charts. See examples below:
BIRT:


Business and Application Based Capacity Management
Actually I was involved in that project too. I was at the beginning of the effort to build custom Cognos based reporting process. We tried to use BIRT reporting and then successfully switched to Cognos.
Interesting, that the presentation has mentioned “Dynamic thresholds”. I thought it is something like control charts do (and by the way during my work on that project I found "out-of-box" BIRT based control chart reports in the TCR and I suggested to use it or to build better ones using COGNOS), but looks like by “Dynamic thresholds” they mean “The ability to change (manually?) to meet customer department adjustments. The threshold metrics can be at the prompt page.”…
I prefer using that term for thresholds that a reporting system automatically changes based on a behavioral learning process.
Much later I have played with BIRT and COGNOS to build control charts. See examples below:
BIRT:

COGNOS:
 Igor Trubin began his engineering career in 1979 as an IBM/370 systems engineer. He earned a Ph.D. in Robotics from St. Petersburg Technical University in 1986 and spent 12 years there as a professor teaching CAD/CAM and Robotics. He has published and presented more than 60 technical papers and conference presentations in robotics, artificial intelligence, IT performance, capacity management, anomaly detection, and FinOps. After moving to the U.S. in 1999, Igor worked at Capital One, IBM, and SunTrust Bank in senior engineering, architecture, and management roles. His 2002 CMG paper on exception detection received a Best Paper Award. He later developed Perfomalist.com, based on his original methods for anomaly, change-point, and trend detection, and created the online course “Performance Anomaly Detection.” At Capital One, he led development of cloud capacity-management and FinOps solutions, including the award-winning OptiCloud application. He has served on the CMG Board of Directors since 2015. Now semi-retired, Igor focuses on research, writing, and consulting. His current work expands his concept of the “Area of Normal Functioning” (ANF) from technical systems to human, orga
Wednesday, May 1, 2013
SCMG report: Jobs Scheduling in Cloud and Hadoop
2015 UPDATE: Now having access to HADOOP I am thinking of how to use Map-Reduce to speed up SETDSing against the big performance data. The flowing thesis could very helpful for that:
Distributed Anomaly Detection andPrevention for Virtual Platforms by Ali Imran Jehangiri
Last week we ran our Richmond SCMG meeting following the agenda published HERE (links to presentations are there too including mine). The 1st presentation was titled: "Some Workload Scheduling Alternatives for High Performance Computing Systems" and presented by Jim McGalliard, the frequent CMG presenter and our friend. He mentioned some old topic he already presented in the past – Supercomputer batch jobs optimization by categorizing and scheduling them. Then after a brief description of MapReduce
( “method for simple implementation of parallelism in a program..”)
he explained how HADOOP
 (“Designed for very large (thousands of processors) systems using commodity processors, including grid systems, Hadoop is a specific open source implementation of the MapReduce framework written in Java and licensed by Apache” )
does job scheduling using MapReduce and some other means.
That presentation leads me to another task to consider – job scheduling in the cloud. Ironically just before the meeting I had red interesting article about it (BTW it was recommended reading from my current manager as we are also going to clouds… What about you?). Here is the link to that article from one of the author’s webpage (Asit K Mishra ) and title:
”Towards Characterizing Cloud Backend Workloads: Insights from Google Compute Clusters”
I firmly believed that the workload characterization is going away due to virtualization - each workload/apps can have separate virtual server now. Right? But based on the article looks like the jobs categorization could be useful for optimizing their schedule to run in the cloud and maybe in HADOOP…
Distributed Anomaly Detection andPrevention for Virtual Platforms by Ali Imran Jehangiri
Last week we ran our Richmond SCMG meeting following the agenda published HERE (links to presentations are there too including mine). The 1st presentation was titled: "Some Workload Scheduling Alternatives for High Performance Computing Systems" and presented by Jim McGalliard, the frequent CMG presenter and our friend. He mentioned some old topic he already presented in the past – Supercomputer batch jobs optimization by categorizing and scheduling them. Then after a brief description of MapReduce
( “method for simple implementation of parallelism in a program..”)
he explained how HADOOP

does job scheduling using MapReduce and some other means.
That presentation leads me to another task to consider – job scheduling in the cloud. Ironically just before the meeting I had red interesting article about it (BTW it was recommended reading from my current manager as we are also going to clouds… What about you?). Here is the link to that article from one of the author’s webpage (Asit K Mishra ) and title:
”Towards Characterizing Cloud Backend Workloads: Insights from Google Compute Clusters”
I firmly believed that the workload characterization is going away due to virtualization - each workload/apps can have separate virtual server now. Right? But based on the article looks like the jobs categorization could be useful for optimizing their schedule to run in the cloud and maybe in HADOOP…
Igor Trubin began his engineering career in 1979 as an IBM/370 systems engineer. He earned a Ph.D. in Robotics from St. Petersburg Technical University in 1986 and spent 12 years there as a professor teaching CAD/CAM and Robotics. He has published and presented more than 60 technical papers and conference presentations in robotics, artificial intelligence, IT performance, capacity management, anomaly detection, and FinOps. After moving to the U.S. in 1999, Igor worked at Capital One, IBM, and SunTrust Bank in senior engineering, architecture, and management roles. His 2002 CMG paper on exception detection received a Best Paper Award. He later developed Perfomalist.com, based on his original methods for anomaly, change-point, and trend detection, and created the online course “Performance Anomaly Detection.” At Capital One, he led development of cloud capacity-management and FinOps solutions, including the award-winning OptiCloud application. He has served on the CMG Board of Directors since 2015. Now semi-retired, Igor focuses on research, writing, and consulting. His current work expands his concept of the “Area of Normal Functioning” (ANF) from technical systems to human, orga
Saturday, April 27, 2013
Modeling the Online Application Migration from Sparc to AIX Platform


The presentation itself was recorded and published here:
Igor Trubin began his engineering career in 1979 as an IBM/370 systems engineer. He earned a Ph.D. in Robotics from St. Petersburg Technical University in 1986 and spent 12 years there as a professor teaching CAD/CAM and Robotics. He has published and presented more than 60 technical papers and conference presentations in robotics, artificial intelligence, IT performance, capacity management, anomaly detection, and FinOps. After moving to the U.S. in 1999, Igor worked at Capital One, IBM, and SunTrust Bank in senior engineering, architecture, and management roles. His 2002 CMG paper on exception detection received a Best Paper Award. He later developed Perfomalist.com, based on his original methods for anomaly, change-point, and trend detection, and created the online course “Performance Anomaly Detection.” At Capital One, he led development of cloud capacity-management and FinOps solutions, including the award-winning OptiCloud application. He has served on the CMG Board of Directors since 2015. Now semi-retired, Igor focuses on research, writing, and consulting. His current work expands his concept of the “Area of Normal Functioning” (ANF) from technical systems to human, orga
Thursday, April 25, 2013
I. Trubin: AIX frame and LPAR level Capacity Planning. User Case for Online Banking Application


[1] Bob Chan: “Unix
Server Sizing – Or What to do When There are No MIPS”, Proceedings of the
Computer Measurement Group, 2000
§[2] Ray White and Igor Trubin: “System Management by Exception, the Final Part”, Proceedings of the
Computer Measurement Group, 2007.
§[3] Linwood Merritt and Igor Trubin: “Disk Subsystem Capacity Management, Based on Business
Drivers, I/O Performance Metrics and MASF ”, Proceedings of the Computer Measurement Group, 2004
§[4] Igor Trubin: “Exception
Based Modeling and Forecasting”, Proceedings of the Computer Measurement Group, 2008
§[6] Jeffrey Buzen
and Annie Shum: "MASF - Multivariate
Adaptive Statistical Filtering", Proceedings of the Computer Measurement Group, 1995,
pp. 1-10.
§[7] Igor Trubin: “How
To Build IT-Control Chart - Use the Excel Pivot Table! “, “System
Management by Exception” tech. blog www.itrubin.blogspot.com
§[8] Linwood Merritt: “A Capacity Planning
Partnership with the Business”,
Proceedings of the Computer Measurement Group, 2004.
Igor Trubin began his engineering career in 1979 as an IBM/370 systems engineer. He earned a Ph.D. in Robotics from St. Petersburg Technical University in 1986 and spent 12 years there as a professor teaching CAD/CAM and Robotics. He has published and presented more than 60 technical papers and conference presentations in robotics, artificial intelligence, IT performance, capacity management, anomaly detection, and FinOps. After moving to the U.S. in 1999, Igor worked at Capital One, IBM, and SunTrust Bank in senior engineering, architecture, and management roles. His 2002 CMG paper on exception detection received a Best Paper Award. He later developed Perfomalist.com, based on his original methods for anomaly, change-point, and trend detection, and created the online course “Performance Anomaly Detection.” At Capital One, he led development of cloud capacity-management and FinOps solutions, including the award-winning OptiCloud application. He has served on the CMG Board of Directors since 2015. Now semi-retired, Igor focuses on research, writing, and consulting. His current work expands his concept of the “Area of Normal Functioning” (ANF) from technical systems to human, orga
Thursday, April 18, 2013
Identify trends and anomalies by using wavelets - CMG'12 paper
Twelve years ago being hired as a Capacity Planner first time and not knowing anything about the specialty, I was asked to look at computer measurements to do any analysis. Applying my academic researcher skills I noticed that server's capacity usage usually shows different seasonality patterns (shifts, weekends, lunch times and so on); so my first impulse was to decompose that to several signals using Fourier Transform. I formulate the task to my manager, but for some reason (to much math and computing power requirements?) he suggested to use just standard statistical approaches instead, and I did…
I did develop and implement SEDS methodology (statistical exception detection) that naturally covers daily and weekly cycles and potentially can uncover monthly and yearly ones if there is enough data history to build baseline.
But Fourier analysis was still in my mind, and I have just been waiting for the time when our computational capacity would be enough to apply the method against system performance data….
That’s why I was positively surprised when I noticed the following paper in CMG’12 agenda:
Introduction to Wavelets and their Application for Computer Performance Trend and Anomaly Detection Dima Seliverstov, BMC Software
ABSTRACT: This paper presents a technique to identify trends and anomalies in Performance data using wavelets.
And of course, I planed (see my past post here), attended and enjoyed that, I know Dima via other CMG events, spoke with him a few times and have already analyzed some other his papers in this blog (The Exception Value Concept to Measure Magnitude of Systems Behavior Anomalies).
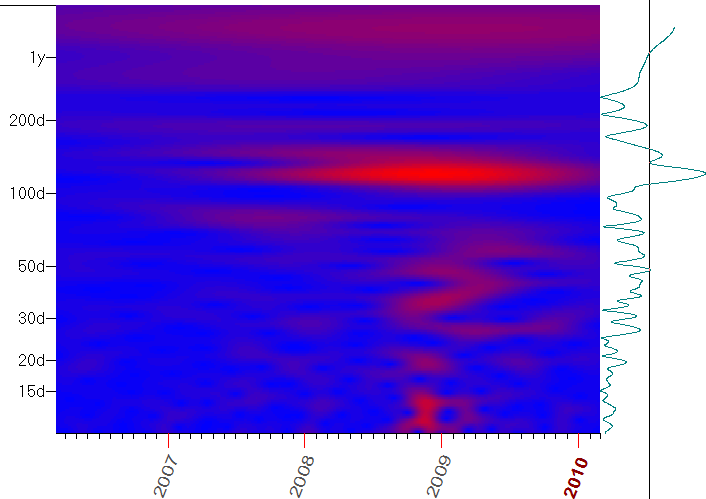
His "wavelet" paper is about implementation of my old dream to use something like Fourier analysis and his idea of decomposing the performance data to combination of typical wavelets is a good attempt to do that. Especially impressive was to see the "Scalogram that is a type of a heat-map to show the location of the energy as a function of frequency and time”: “Scalogram is a heat map for wavelets transformation”. Some interesting examples (including against VMware VCenter data) were presented and was calculated by MATLAB tool:

BTW stock market is already adopting this idea, the paper references that: Wavelets for Stock Market Analysis
Why not us?
… Ironically the same manager asks me now to analyze how business cycles drive capacity usage….
I did develop and implement SEDS methodology (statistical exception detection) that naturally covers daily and weekly cycles and potentially can uncover monthly and yearly ones if there is enough data history to build baseline.
But Fourier analysis was still in my mind, and I have just been waiting for the time when our computational capacity would be enough to apply the method against system performance data….
That’s why I was positively surprised when I noticed the following paper in CMG’12 agenda:
Introduction to Wavelets and their Application for Computer Performance Trend and Anomaly Detection Dima Seliverstov, BMC Software
ABSTRACT: This paper presents a technique to identify trends and anomalies in Performance data using wavelets.
And of course, I planed (see my past post here), attended and enjoyed that, I know Dima via other CMG events, spoke with him a few times and have already analyzed some other his papers in this blog (The Exception Value Concept to Measure Magnitude of Systems Behavior Anomalies).
His "wavelet" paper is about implementation of my old dream to use something like Fourier analysis and his idea of decomposing the performance data to combination of typical wavelets is a good attempt to do that. Especially impressive was to see the "Scalogram that is a type of a heat-map to show the location of the energy as a function of frequency and time”: “Scalogram is a heat map for wavelets transformation”. Some interesting examples (including against VMware VCenter data) were presented and was calculated by MATLAB tool:
BTW stock market is already adopting this idea, the paper references that: Wavelets for Stock Market Analysis
Why not us?
… Ironically the same manager asks me now to analyze how business cycles drive capacity usage….
Igor Trubin began his engineering career in 1979 as an IBM/370 systems engineer. He earned a Ph.D. in Robotics from St. Petersburg Technical University in 1986 and spent 12 years there as a professor teaching CAD/CAM and Robotics. He has published and presented more than 60 technical papers and conference presentations in robotics, artificial intelligence, IT performance, capacity management, anomaly detection, and FinOps. After moving to the U.S. in 1999, Igor worked at Capital One, IBM, and SunTrust Bank in senior engineering, architecture, and management roles. His 2002 CMG paper on exception detection received a Best Paper Award. He later developed Perfomalist.com, based on his original methods for anomaly, change-point, and trend detection, and created the online course “Performance Anomaly Detection.” At Capital One, he led development of cloud capacity-management and FinOps solutions, including the award-winning OptiCloud application. He has served on the CMG Board of Directors since 2015. Now semi-retired, Igor focuses on research, writing, and consulting. His current work expands his concept of the “Area of Normal Functioning” (ANF) from technical systems to human, orga
Tuesday, April 9, 2013
SCMG meeting in Richmond: AIX frame and LPAR level Capacity Planning
The CMG - Southern Region meeting is scheduled April 25, 2013. I will be presenting again my CMG'12 paper:
AIX frame and LPAR level Capacity Planning. User Case for Online Banking Application
Here is agenda: LINK:
 Registration:
http://regions.cmg.org/regions/scmg/spring_13/richmond/reg.htm
Location: Northrop Grumman IT, VITA Project
11751 Meadowville Lane, 2S-J3
Chester, VA 23836
AIX frame and LPAR level Capacity Planning. User Case for Online Banking Application
Here is agenda: LINK:

http://regions.cmg.org/regions/scmg/spring_13/richmond/reg.htm
Location: Northrop Grumman IT, VITA Project
11751 Meadowville Lane, 2S-J3
Chester, VA 23836
Igor Trubin began his engineering career in 1979 as an IBM/370 systems engineer. He earned a Ph.D. in Robotics from St. Petersburg Technical University in 1986 and spent 12 years there as a professor teaching CAD/CAM and Robotics. He has published and presented more than 60 technical papers and conference presentations in robotics, artificial intelligence, IT performance, capacity management, anomaly detection, and FinOps. After moving to the U.S. in 1999, Igor worked at Capital One, IBM, and SunTrust Bank in senior engineering, architecture, and management roles. His 2002 CMG paper on exception detection received a Best Paper Award. He later developed Perfomalist.com, based on his original methods for anomaly, change-point, and trend detection, and created the online course “Performance Anomaly Detection.” At Capital One, he led development of cloud capacity-management and FinOps solutions, including the award-winning OptiCloud application. He has served on the CMG Board of Directors since 2015. Now semi-retired, Igor focuses on research, writing, and consulting. His current work expands his concept of the “Area of Normal Functioning” (ANF) from technical systems to human, orga
Wednesday, March 6, 2013
%V\ (%EV) to plot under Control Chart
The post Exception Value (EV) Metrics and Technical Analysis Indicators
introduced EV based metric (%V\) that I promised to find a good application for. And I did. That should be a needles (or bars) type of graph under the main control chart to mark hours that had anomalies (exceptions). Actually that idea was suggested by one of this blog guest poster (STEEDd: Another Implementation of The Near-Real-Time Control Charting and EV Calculating).
See example:

See example:
 Igor Trubin began his engineering career in 1979 as an IBM/370 systems engineer. He earned a Ph.D. in Robotics from St. Petersburg Technical University in 1986 and spent 12 years there as a professor teaching CAD/CAM and Robotics. He has published and presented more than 60 technical papers and conference presentations in robotics, artificial intelligence, IT performance, capacity management, anomaly detection, and FinOps. After moving to the U.S. in 1999, Igor worked at Capital One, IBM, and SunTrust Bank in senior engineering, architecture, and management roles. His 2002 CMG paper on exception detection received a Best Paper Award. He later developed Perfomalist.com, based on his original methods for anomaly, change-point, and trend detection, and created the online course “Performance Anomaly Detection.” At Capital One, he led development of cloud capacity-management and FinOps solutions, including the award-winning OptiCloud application. He has served on the CMG Board of Directors since 2015. Now semi-retired, Igor focuses on research, writing, and consulting. His current work expands his concept of the “Area of Normal Functioning” (ANF) from technical systems to human, orga
IT-Control Charts: How to Read, How to Use


YouTube version of the presentation:
Igor Trubin began his engineering career in 1979 as an IBM/370 systems engineer. He earned a Ph.D. in Robotics from St. Petersburg Technical University in 1986 and spent 12 years there as a professor teaching CAD/CAM and Robotics. He has published and presented more than 60 technical papers and conference presentations in robotics, artificial intelligence, IT performance, capacity management, anomaly detection, and FinOps. After moving to the U.S. in 1999, Igor worked at Capital One, IBM, and SunTrust Bank in senior engineering, architecture, and management roles. His 2002 CMG paper on exception detection received a Best Paper Award. He later developed Perfomalist.com, based on his original methods for anomaly, change-point, and trend detection, and created the online course “Performance Anomaly Detection.” At Capital One, he led development of cloud capacity-management and FinOps solutions, including the award-winning OptiCloud application. He has served on the CMG Board of Directors since 2015. Now semi-retired, Igor focuses on research, writing, and consulting. His current work expands his concept of the “Area of Normal Functioning” (ANF) from technical systems to human, orga
Friday, February 22, 2013
Exception Value (EV) Metrics and Technical Analysis Indicators
I HAD TO RE-ENTER THIS POST (from e-mail copy I got about my previous posting) AS BLOGGER HAS LOST MY ORIGINAL ONE!!!!
This is my 1st CMG’12 trip report.
The
following CMG workshop: Albert
Mavashev - "Ensuring the Performance of Business‐Critical Apps in the Cloud" on a top of
Cloud monitoring topic has touched the subject that relates to this
blog.
The
author offers to apply some indicators from technical analysis (of securities trading) to detect anomalies or
resource leaks against
computer performance data.
Apparently the author was
not aware of the System performance exceptions/anomalies /changes detection methodologies that are commonly used
in the IT Capacity Management, such as MASF and SETDS (SEDS), but he naturally came to idea of doing that and
took what already used for similar purposes in technical
analysis.
I believe that EV based approach that SETDS methodology uses is more
appropriate for Computer performance data, but I am always opened to evaluate
other means (and often do that in this blog postings)
So,
Bollinger Bands are similar to Upper and Lower Control Limits in SPC. More interesting is that in 2010 the %b (pronounced "percent b") indicator (derived from Stochastic oscillator) was introduced and that somewhat similar to EV-meta-metric I have introduced in 2001. It is similar but in inverse way! p% is between 0 and 100 for actual data WITHIN the band, but EV become non-0 when actual data go OUTSIDE the band.
Applying the same idea we can alslo also normalize EV
metric (lets call it “%И”) to the |UCL-LCL| band:
 So if the actual data is
not an anomaly, %И=0;
if it is a actual data jump that is higher
than UCL or lower than LCL in a half of band – it will be %И >100%.
Not sure whether it make
some practical sense or not, but really interesting twist!
Let me play with this %И indicator
finding the good place to use and I will report here of any good
results.....
In return I would suggest to apply
EV and %И indicators to technical analysis to estimate magnitude
of some market unusual responses! Why
not?
--
Posted By Blogger to System Management by Exception at 1/29/2013 06:00:00 PM
(BUT LOST!!! - my comment iTrubin)
Igor Trubin began his engineering career in 1979 as an IBM/370 systems engineer. He earned a Ph.D. in Robotics from St. Petersburg Technical University in 1986 and spent 12 years there as a professor teaching CAD/CAM and Robotics. He has published and presented more than 60 technical papers and conference presentations in robotics, artificial intelligence, IT performance, capacity management, anomaly detection, and FinOps. After moving to the U.S. in 1999, Igor worked at Capital One, IBM, and SunTrust Bank in senior engineering, architecture, and management roles. His 2002 CMG paper on exception detection received a Best Paper Award. He later developed Perfomalist.com, based on his original methods for anomaly, change-point, and trend detection, and created the online course “Performance Anomaly Detection.” At Capital One, he led development of cloud capacity-management and FinOps solutions, including the award-winning OptiCloud application. He has served on the CMG Board of Directors since 2015. Now semi-retired, Igor focuses on research, writing, and consulting. His current work expands his concept of the “Area of Normal Functioning” (ANF) from technical systems to human, orga
Tuesday, January 29, 2013
Database Space Capacity Planning: Exception Based Method
In my 2008 CMG paper "Exception based Modeling and Forecasting" I have mentioned some approach that my colleague, coauthor and friend Ray W. implemented to provide proactive Database Space Capacity planning:

By the way, my first and best American manager is mentioned there - Kevin M. As stated in the paper he has actually gave me the idea of the SEDS and he was the co-author of my 1st SEDS related CMG'01 paper - Exception Detection System, Based on the Statistical Process Control Concept
Igor Trubin began his engineering career in 1979 as an IBM/370 systems engineer. He earned a Ph.D. in Robotics from St. Petersburg Technical University in 1986 and spent 12 years there as a professor teaching CAD/CAM and Robotics. He has published and presented more than 60 technical papers and conference presentations in robotics, artificial intelligence, IT performance, capacity management, anomaly detection, and FinOps. After moving to the U.S. in 1999, Igor worked at Capital One, IBM, and SunTrust Bank in senior engineering, architecture, and management roles. His 2002 CMG paper on exception detection received a Best Paper Award. He later developed Perfomalist.com, based on his original methods for anomaly, change-point, and trend detection, and created the online course “Performance Anomaly Detection.” At Capital One, he led development of cloud capacity-management and FinOps solutions, including the award-winning OptiCloud application. He has served on the CMG Board of Directors since 2015. Now semi-retired, Igor focuses on research, writing, and consulting. His current work expands his concept of the “Area of Normal Functioning” (ANF) from technical systems to human, orga
Friday, January 4, 2013
The Open Group Certified IT Specialist (Open CITS)
 Igor Trubin began his engineering career in 1979 as an IBM/370 systems engineer. He earned a Ph.D. in Robotics from St. Petersburg Technical University in 1986 and spent 12 years there as a professor teaching CAD/CAM and Robotics. He has published and presented more than 60 technical papers and conference presentations in robotics, artificial intelligence, IT performance, capacity management, anomaly detection, and FinOps. After moving to the U.S. in 1999, Igor worked at Capital One, IBM, and SunTrust Bank in senior engineering, architecture, and management roles. His 2002 CMG paper on exception detection received a Best Paper Award. He later developed Perfomalist.com, based on his original methods for anomaly, change-point, and trend detection, and created the online course “Performance Anomaly Detection.” At Capital One, he led development of cloud capacity-management and FinOps solutions, including the award-winning OptiCloud application. He has served on the CMG Board of Directors since 2015. Now semi-retired, Igor focuses on research, writing, and consulting. His current work expands his concept of the “Area of Normal Functioning” (ANF) from technical systems to human, orga
Monday, December 17, 2012
IT Specialist Certification for Actualizing IT Solutions
I have finally got certified:

 Igor Trubin began his engineering career in 1979 as an IBM/370 systems engineer. He earned a Ph.D. in Robotics from St. Petersburg Technical University in 1986 and spent 12 years there as a professor teaching CAD/CAM and Robotics. He has published and presented more than 60 technical papers and conference presentations in robotics, artificial intelligence, IT performance, capacity management, anomaly detection, and FinOps. After moving to the U.S. in 1999, Igor worked at Capital One, IBM, and SunTrust Bank in senior engineering, architecture, and management roles. His 2002 CMG paper on exception detection received a Best Paper Award. He later developed Perfomalist.com, based on his original methods for anomaly, change-point, and trend detection, and created the online course “Performance Anomaly Detection.” At Capital One, he led development of cloud capacity-management and FinOps solutions, including the award-winning OptiCloud application. He has served on the CMG Board of Directors since 2015. Now semi-retired, Igor focuses on research, writing, and consulting. His current work expands his concept of the “Area of Normal Functioning” (ANF) from technical systems to human, orga
IT Capacity Council related CMG papers
- R. Kephart The Job You Save
- Linwood Merritt: 1. Seeing the Forest AND the Trees: Capacity Planning for a Large Number of Servers (CMG Paper)
- Igor Trubin (me)
Igor Trubin began his engineering career in 1979 as an IBM/370 systems engineer. He earned a Ph.D. in Robotics from St. Petersburg Technical University in 1986 and spent 12 years there as a professor teaching CAD/CAM and Robotics. He has published and presented more than 60 technical papers and conference presentations in robotics, artificial intelligence, IT performance, capacity management, anomaly detection, and FinOps. After moving to the U.S. in 1999, Igor worked at Capital One, IBM, and SunTrust Bank in senior engineering, architecture, and management roles. His 2002 CMG paper on exception detection received a Best Paper Award. He later developed Perfomalist.com, based on his original methods for anomaly, change-point, and trend detection, and created the online course “Performance Anomaly Detection.” At Capital One, he led development of cloud capacity-management and FinOps solutions, including the award-winning OptiCloud application. He has served on the CMG Board of Directors since 2015. Now semi-retired, Igor focuses on research, writing, and consulting. His current work expands his concept of the “Area of Normal Functioning” (ANF) from technical systems to human, orga
Tuesday, November 20, 2012
SETDS Methodology
2022 UPDATE
Some of the SETDS features are implemented into www.Perfomalist.com tool, which is described in the following post: https://www.trutechdev.com/2021/12/ and last release notes are HERE . The detailed Perfomalist CPD method is explained in this blog: https://www.trub.in/2020/08/cpd-change-points-detection-is-planed.html
_________________________________________________________________________________
Preparing my upcoming CMG'12 presentation about SEDS-lite I try to formulate what SEDS or extended version of that - SETDS actually is.
SE(T)DS is Statistical Exception (and Trend) Detection System. It is not an application. But could be implemented by developing one. And I have done that several times (using SAS, COGNOS, BIRT, R and other programming/reporting systems). But developing SETDS-like reports/apps is just a beginning. The most important part of SETDS is how to use that for Systems Capacity Management and how to build that in the Service Management processes. The set of my CMG papers I wrote since 2001 (list is in the very 1st post of this blog) describes that in details.
By the way it is not absolutely necessary to develop the SETDS application because starting from BMC PP and visualizer (now it is Capacity Optimizer, Perceiver and Proactive Net) a lot of performance tools have SETDS-like features and this blog has several posts analyzing them (e.g. see Gartner's Magic Quadrant).
A Capacity Manager just need to know how to use the home made or vendor based SETDS-like tools features efficiently and SETDS is the method.
So bottom line is:
SETDS is the methodology of using statistical filtering, pattern recognition, active base-lining, dynamic vs. static thresholds, IT-Control Charts, Exception Value (EV) based reporting/smart alerting and EV based change points/trends detection to do Systems Capacity Management including Capacity Planning and Performance Engineering.
What value SETDS could bring to a company? I will formulate that later during and after my CMG'12 presentations on which you are welcome to attend (www.CMG.org)!
(2018 UPDATE: Note , SEDS is the unsupervised SPC/MASF ML based Anomaly Detection method)
SE(T)DS is Statistical Exception (and Trend) Detection System. It is not an application. But could be implemented by developing one. And I have done that several times (using SAS, COGNOS, BIRT, R and other programming/reporting systems). But developing SETDS-like reports/apps is just a beginning. The most important part of SETDS is how to use that for Systems Capacity Management and how to build that in the Service Management processes. The set of my CMG papers I wrote since 2001 (list is in the very 1st post of this blog) describes that in details.
By the way it is not absolutely necessary to develop the SETDS application because starting from BMC PP and visualizer (now it is Capacity Optimizer, Perceiver and Proactive Net) a lot of performance tools have SETDS-like features and this blog has several posts analyzing them (e.g. see Gartner's Magic Quadrant).
A Capacity Manager just need to know how to use the home made or vendor based SETDS-like tools features efficiently and SETDS is the method.
So bottom line is:
SETDS is the methodology of using statistical filtering, pattern recognition, active base-lining, dynamic vs. static thresholds, IT-Control Charts, Exception Value (EV) based reporting/smart alerting and EV based change points/trends detection to do Systems Capacity Management including Capacity Planning and Performance Engineering.
What value SETDS could bring to a company? I will formulate that later during and after my CMG'12 presentations on which you are welcome to attend (www.CMG.org)!
(2018 UPDATE: Note , SEDS is the unsupervised SPC/MASF ML based Anomaly Detection method)
CPD perfomalist example:
 Igor Trubin began his engineering career in 1979 as an IBM/370 systems engineer. He earned a Ph.D. in Robotics from St. Petersburg Technical University in 1986 and spent 12 years there as a professor teaching CAD/CAM and Robotics. He has published and presented more than 60 technical papers and conference presentations in robotics, artificial intelligence, IT performance, capacity management, anomaly detection, and FinOps. After moving to the U.S. in 1999, Igor worked at Capital One, IBM, and SunTrust Bank in senior engineering, architecture, and management roles. His 2002 CMG paper on exception detection received a Best Paper Award. He later developed Perfomalist.com, based on his original methods for anomaly, change-point, and trend detection, and created the online course “Performance Anomaly Detection.” At Capital One, he led development of cloud capacity-management and FinOps solutions, including the award-winning OptiCloud application. He has served on the CMG Board of Directors since 2015. Now semi-retired, Igor focuses on research, writing, and consulting. His current work expands his concept of the “Area of Normal Functioning” (ANF) from technical systems to human, orga
Wednesday, November 14, 2012
SAS code to build Control Chart
As I have already shared at the "The Master of MASF" post there was the CMG presentation (where BTW my work and this blog were mentioned) that illustrates how to use SAS to build MASF Control Charts.
The two parts of that presentation are available at the www.MXG.com along with link to SAS code that could be used to build control charts:
The two parts of that presentation are available at the www.MXG.com along with link to SAS code that could be used to build control charts:
| Automatic Daily Monitoring of Continuous Processes
Theory and Practice Frank Bereznay and MP Welch (UKCMG2011) (SWCMG2011) |
||
| Filename | Size (bytes) | Date Posted |
| ADMCP Part 1 PDF | 1,178 KB | May 17, 2011 |
| ADMCP Part 2 PDF | 8,719 KB | May 17, 2011 |
| Coding Sample admcp_sample.sas | 4KB | May 17, 2011 |
| HTMLBLUE SG 9.3 Style Preview (Make 9.2 look like 9.3) | 31KB | May 17, 2011 |
Igor Trubin began his engineering career in 1979 as an IBM/370 systems engineer. He earned a Ph.D. in Robotics from St. Petersburg Technical University in 1986 and spent 12 years there as a professor teaching CAD/CAM and Robotics. He has published and presented more than 60 technical papers and conference presentations in robotics, artificial intelligence, IT performance, capacity management, anomaly detection, and FinOps. After moving to the U.S. in 1999, Igor worked at Capital One, IBM, and SunTrust Bank in senior engineering, architecture, and management roles. His 2002 CMG paper on exception detection received a Best Paper Award. He later developed Perfomalist.com, based on his original methods for anomaly, change-point, and trend detection, and created the online course “Performance Anomaly Detection.” At Capital One, he led development of cloud capacity-management and FinOps solutions, including the award-winning OptiCloud application. He has served on the CMG Board of Directors since 2015. Now semi-retired, Igor focuses on research, writing, and consulting. His current work expands his concept of the “Area of Normal Functioning” (ANF) from technical systems to human, orga
Wednesday, October 24, 2012
Not a MASF Based Statistical Techniques (Entropy-based) for Anomaly Detection in Data Centers (and Clouds)
The following papers published on Mendeley criticizes the MASF Gaussian
assumption and offer other methods (Tukey and
Relative Entropy) to detect anomalies statistically. (BTW I tried to use the entropy analysis to capture performance anomalies - check my other post)
1. Statistical techniques for online anomaly detection in data centers
by , , , , ,
Abstract

2. Online detection of utility cloud anomalies using metric distributions
1. Statistical techniques for online anomaly detection in data centers
by , , , , ,
Abstract
Online anomaly detection is an important step in
data center management, requiring light-weight techniques that provide
sufficient accuracy for subsequent diagnosis and management actions.
This paper presents statistical techniques based on the Tukey and
Relative Entropy statistics, and applies them to data collected from a
production environment and to data captured from a testbed for
multi-tier web applications running on server class machines. The
proposed techniques are lightweight and improve over standard Gaussian
assumptions in terms of performance.

2. Online detection of utility cloud anomalies using metric distributions
Igor Trubin began his engineering career in 1979 as an IBM/370 systems engineer. He earned a Ph.D. in Robotics from St. Petersburg Technical University in 1986 and spent 12 years there as a professor teaching CAD/CAM and Robotics. He has published and presented more than 60 technical papers and conference presentations in robotics, artificial intelligence, IT performance, capacity management, anomaly detection, and FinOps. After moving to the U.S. in 1999, Igor worked at Capital One, IBM, and SunTrust Bank in senior engineering, architecture, and management roles. His 2002 CMG paper on exception detection received a Best Paper Award. He later developed Perfomalist.com, based on his original methods for anomaly, change-point, and trend detection, and created the online course “Performance Anomaly Detection.” At Capital One, he led development of cloud capacity-management and FinOps solutions, including the award-winning OptiCloud application. He has served on the CMG Board of Directors since 2015. Now semi-retired, Igor focuses on research, writing, and consulting. His current work expands his concept of the “Area of Normal Functioning” (ANF) from technical systems to human, orga