

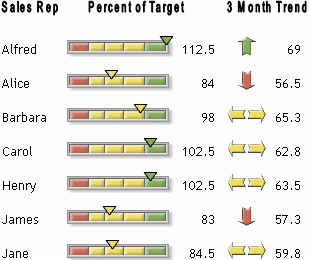
But how correctly to choose the direction? Based on
what? My suggestion is to
use Exception Value (EV) meta metric (Check how that should
be calculated here: EV-Control Chart). Indeed, for the given
most recent time period (e.g. day, week or month) EV will be greater than 0 , if more
UCL crossings happened than LCL crossings; EV
will be 0 if everything occurred within
UCL-LCL band; and EV will be less than 0, if more LCL crossings happened than UCL crossings.
That criterion have been already used to detect most recent trends, but the same
way that could be used to choose the right direction for the trend arrow on
dashboards!
So the
Trubin's Criterion would be:



3 comments:
24469EADF7
Takipçi Satın Al
M3u Listesi
Online Oyunlar
Eti Mutlu Kutu Kodları
101 Okey Vip Hediye Kodu
8375A29F
Osmangazi
Marmaris
Tavşanlı
Milas
Bitez
Salihli
Kilyos
Mut
Nizip
B635FF7B
Kırıkhan
Menemen
Reyhanlı
Yakuplu
Yüksekova
Urla
Alpu
Beykoz
Akçakoca
Post a Comment