I was pointed to the nice resent on-line publication:
https://datascienceplus.com/implementation-and-interpretation-of-control-charts-in-r/
"...
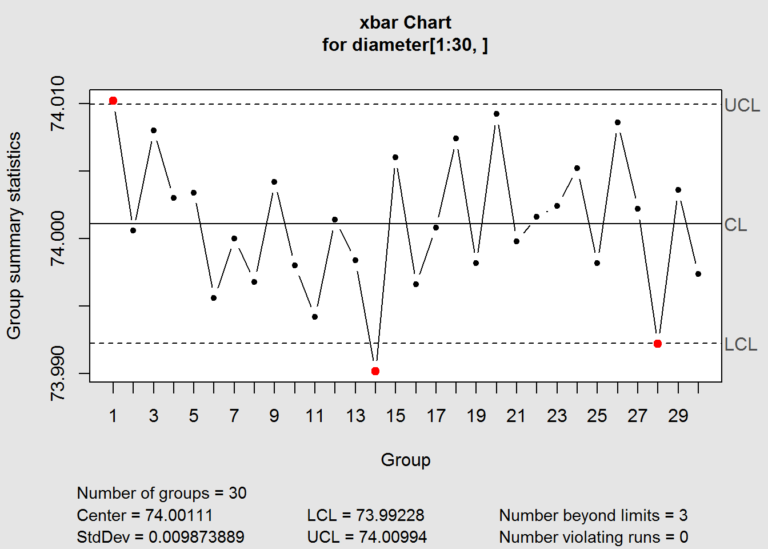
Control charts are used during the Control phase of DMAIC
methodology. Control charts, also known as Shewhart charts or process-behavior
charts, are a statistical process control tool used to determine if a
manufacturing or business process is in a state of control. If analysis of the
control chart indicates that the process is currently under control, then no
corrections or changes to process control parameters are needed. Moreover, data
from the method can be used to predict the future performance of the
process. If the control chart indicates that the process is not in
control, analysis of the chart can help determine the sources of variation, as
this will result in degradation of process performance..."
My comment:
When I had been developing SEDS (Performance Anomaly Detection System) long
ago (years ago) I looked at that package (and referenced the link to my early
CMG papers, BTW) even not knowing how to write R programs (now I can!)... They
might improved that, but I did not find that time the way to do MASF type of
control charts. I have even dreamed to build SETDS charts (IT-Control
Charts) package on a open source way. So my approach is the same but
different, please read details in my paper:
https://www.researchgate.net/publication/259486289_IT-Control_Chart


No comments:
Post a Comment