Popular Post

Monday, July 7, 2014

SEDS Elements in "Flood Risk Pattern Recognition" in Malaysia

My SETDS methodology should work fine with any datetime stamped data. So here is an attempt to apply some similar technique for "Flood Risk Pattern Recognition" in Malaysia:

[PDF] Flood Risk Pattern Recognition Using Chemometric Technique: A Case Study in Muda River Basin  (Computational Water, Energy, and Environmental Engineering) by Ahmad Shakir Mohd Saudi and others


..."Time Series Analysis is essential for the prediction of water level in the study area, where this method enables
an efficient evaluation of the process from the performance by analyzing data. The method produces three important
data (e.g., Upper Control Limit (UCL), Average Value (AVG) and Lower Control Limit (LCL)) for the
trend and prediction of future hydrological modelling, where the Sigma is within a range value of a set of data.Control Chart can detect some trends and patterns with actual data deviations from historical baseline, be able to capture unusual resource usage, can determine the dynamic threshold, and also can become the best base lining to examine the actual data deviation from the historical baseline (Igor Trubin, 2008) [7]. The equation implementedin this analysis was:
                                     Moving Range = Plot : MRt for t = 2, 3,, m.  ...
 
[7] Trubin, I.A. (2008) Exception Based Modelling and Forecasting. Proceedings of the Computer Measurement Group, Nevada, 7-12 December 2008, 353-364..."
 

Wednesday, April 2, 2014

Here is one good reason I decided to move back to Capital One

Actually it is a few reasons well expressed in the following Informationweek article:

Capital One IT Overhaul Powers Digital Strategy:

"If digital is so central to our strategy, we really need an IT organization that is able to deliver like a technology company and not like a traditional bank"

"The company wants to compete with technology companies like Google and Microsoft for top development, engineering, and infrastructure talent"


"... it's thought of as a primo place to do software development. It acquired several banking tech startups in part to get the development talent it needs."

"Capital One is in the midst of moving from 70% to 75% outsourced IT to 70% to 75% in-house."


Monday, March 31, 2014

Southern Computer Measurement Group Spring 2014 meetings


Richmond - April 17, 2014 


Agenda:
TimeSessionPresenter
 8:00-9:00
Registration, Continental Breakfast and Sponsor Presentation 
 9:00-10:00
Memory CachesClaire Cates
 10:00-11:00
High Performance Computing SystemsJames McGalliard
 11:00-12:00
ePrivacy Issues and their Potential Effect on Online Data CollectionAnna Long
 12:00-1:00
Lunch and Sponsor Presentation 
 1:00-2:00
z/OS Performance "HOT" TopicsKathy Walsh
 2:00-3:00
DB2 v11 PerformanceJohn Iczkovits
 3:00-4:00
Database PerformancePeter Zaitsev
 4:00-5:00
Open Discussion - Future Meeting ContentBryan Drake

 Register here

Raleigh - April 11, 2014

Agenda:
TimeSessionPresenter
 8:00-8:30
Registration, Continental Breakfast and Sponsor Presentation 
 8:30-9:30
Memory CachesClaire Cates
 9:30-10:30
High Performance Computing SystemsJames McGalliard
 10:30-11:30
Data Center Capacity PlanningChris Molloy
 11:30-12:30
Effective Reporting – Making Sure You Tell the StoryJim Horne
 12:30-1:30
Lunch and Sponsor Presentation 
 1:30-2:30
z/OS Performance "HOT" TopicsKathy Walsh
 2:30-3:30
Performance and Capacity in the Broader Context of Non-Functional RequirementsAnn Dowling
 3:30-4:30
DB2 v11 PerformanceMark Rader
 4:30-5:00
Open Discussion - Future Meeting ContentBryan Drake
Register here
 

Wednesday, March 19, 2014

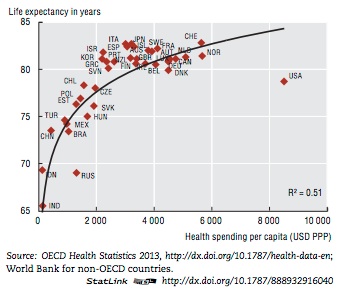
USA is not in "blue" zone...

Thursday, February 13, 2014

Tree-map / Heat-chart / Tile chart is good for the data analysis visualization/dash-boarding

Any good reporting should be fully automated and web based with no more then 2-3 levels of drill-downs and the highest level should be a color-coded dashboard. So what is the best mean for color-coded dashboard? Nowadays the tile (heat) chart is getting more and more popular for that purpose!

A bit history:

•        The  original source of the tree-map idea: Treemaps for space-constrained visualization of hierarchies by Ben Shneiderman
•         CMG papers about tree-mapping of capacity usage metrics: 

CMG 2004: Seeing the Forest AND the Trees: Capacity Planning for a Large Number of Servers.


The following two examples from the paper:

CMG 2003: Disk Subsystem Capacity Management, Based on Business Drivers, I/O Performance Metrics and MASF         


CMG 2006: System Management by Exception, Part 6

The following  two examples from the papers: (at the left is the SEDS based report):

Possibly with some influence from the above mentioned papers that type of dash-boarding was adopted by several tools including SAS:


So since SAS 9.3 it is ease to build an interactive tile chart with drill-downs and even with a context “right click” menus to call trend or control charts by parametric URLs. Applying that to SETDS reports the boxes (tiles) size could be EV (By the way, the EV usage for dash-boarding was already discussed in other post HERE)

The Tableau tool is getting more and more popular and there is away to build the self-configurable tree-maps and that looks better than SAS ones. Example: 

Another popular way to build tree-maps now is D3.js JavaScript library. See the code sample here and the result is below: 


Wednesday, January 29, 2014

MXG against NMON to process AIX performance data

In my last www.CMG.org paper "AIX frame and LPAR level Capacity Planning. User Case for Online Banking Application" I have demonstrated how to analyze AIX server based application performance by exceptions (including IT-Control charting).  

But what type of server performance data I used for that? NMON data. And how to process that data? I would recommenced to use SAS and MXG -  that is the way,  if you are lucky to have access to SAS and MXG tools ...

Below are a few hints for readers who want to try to set up MXG to process NMON data.

How to set up and run MXG against AIX nmon data is documented in the following useful ppt document http://mxg.com/downloads/chuck/mxgtoolmagic.ppt that has ASCII installation and tailoring instructions starting from page 16.

-        There is also install.sas document inside of MXM package .../mxg/sourclib that has the following instructions regarding ascii installation:

"****************************************************************
    For ASCII Execution:

    Instead of JCL Procs, it is the AUTOEXEC.SAS file that conrols and
    sets up the MXG environment.  You will need to copy and EDIT the MXG
    example autoexec for the directory names, etc., for your platform
       AUTOEXEC  -   SAS - Windows
       AUTOEXEU  -   SAS - Unix
       AUTOEXEW  -   WPS - All ASCII
    into the your SAS root directory, if all users are MXG users, or you
    can add the -autoexec option to the start-up icon, or in batch, use
      sas -autoexec 'c:\mxg\userid\autoexec.sas' ...

************************************************************************"
When the MXG environment is set up properly, to run MXG against NMON data and creating PDBs with nmon data one needs to do just following steps:

-    - Submit FILENAME NMONIN  "*.nmon";  * to provide the path to raw nmon log file;
-    - Submit TYPENMON macro:

%INCLUDE SOURCLIB(VMACNMON,IMACKEEP);
DATA
_VARNMON
_CDENMON
_SNMON

To prove/test that I have:
 
-         -  copied MXG folder (could be downloaded from MXG) to my laptop folder to C:\MXG\sourclib;
-          - created a few new folders like C:\MXG\PDB  (see p. 17 ) ;
-          - modified a bit and submitted  the autoexec.sas (I have added there the nmon log to process - “FILENAME NMONIN   "C:\MXG\DATA\aprcmix1_131212_0000.nmon" LRECL=32000;”
-         -  submitted  C:\MXG\sourclib\formats macro to rebuild formats library ;
-          - submitted the main macro C:\MXG\sourclib\typenmon  to process “C:\MXG\DATA\prix1.nmon” and build PDB with nmon SAS datasets in C:\MXG\PDB ;
-          - checked the resulted PDBs in C:\MXG\PDB. 


Last thing is to use SAS /IML with R to build control charts (HERE hints how to do that) or if you have SAS/Graph - HERE is how to use that.

Good luck! And put you questions to comments!


Friday, January 24, 2014

R script to run in SAS: one more way to built IT-Control Chart

Sure SAS and SAS/GRAPH is good to plot (control) charts. See example here, But if you are a R lover you can also submit R script in SAS to do any analysis or charting you want. How?

SAS 9.3 can be used to run R scripts and packages within SAS/IML proc. To do that the following needs to be done:


1. Check if your SAS instance support R language. Just submit "proc options option=RLANG; run;" and check the sas log. If that is not supported, do next:
2. Add the following line at the end of the config file:
  C:\Program Files (x86)\SASHome\SASFoundation\9.3\nls\en\sasv9.cfg

-RLANG

3. Install  R-2.15.3 for Windows (32/64 bit) (note the R version 3 is not supported by SAS at this point)
4. Insert R-script to the following SAS/IML script:   
         proc iml;
          submit / R;
..... your R scrpt is here ....
        endsubmit;

5. Some simple test R-scripts samples to run in SAS is  below:
proc iml;
/* Comparison of matrix operations in IML and R */
print "----------  SAS/IML Results  -----------------";
x = 1:3;                                 /* vector of sequence 1,2,3 */
m = {1 2 3, 4 5 6, 7 8 9};               /* 3 x 3 matrix */
q = m * t(x);                            /* matrix multiplication */
print q;
print "-------------  R Results  --------------------";
submit / R;
  rx <- 1:3="" 1="" matrix="" nrow="1)            " of="" sequence="" span="" vector="">
  rm <- 1:9="" 3="" byrow="TRUE)" matrix="" nrow="3," span="" x="">
  rq <- matrix="" multiplication="" nbsp="" rm="" rx="" span="" t="">
  print(rq)
endsubmit;

More complex example:   Call R Packages from PROC IML

And finally my own script to build IT-Control Chart against CSV data is following:
proc iml;
submit / R;
## R script to plot IT-chart against CSV data - Igor Trubin 2009
cchrt <- appsdata.csv="" header="T," ocuments="" read.table="" sep="," sers="" span="" workshop="">
plot    (cchrt[,1],cchrt[,2],type="l",col="black",ylim=c(0,0.15),lwd=1.6,ann=F)
points (cchrt[,1],cchrt[,3],type="l",col="red",   ylim=c(0,0.15),lwd=1,ann=F)
points (cchrt[,1],cchrt[,4],type="l",col="green",ylim=c(0,0.15),lwd=1,ann=F)
points (cchrt[,1],cchrt[,5],type="l",col="blue", ylim=c(0,0.15),lwd=1,ann=F)
points (cchrt[,1],cchrt[,6],type="l",col="MAGENTA", ylim=c(0,0.1),lwd=1,ann=F)
mtext("I/O Time/Thrd",   side=2, line=3.0)
mtext("hours of week",   side=1, line=3.0)
mtext("IT-CHART",        side=3, line=1.0)
legend(10,0.16,c("Actual","UpperLimit","Mean","LowerLimit"),
          col=c("black","red","green","blue"),lwd=c(.2,.1,.1,.1),bty="n")
endsubmit;


The code is similar to the one I published in my other post here. And below is the result:

Monday, December 30, 2013

"Review of IT Control Chart" - my new paper in Journal of Emerging Trends in Computing and Information Sciences

Try building IT-Control Charts by free Perfomalist.com web tool:

Full Textat RG
AuthorIgor Trubin
ISSN2079-8407
On Pages857-868
Volume No.4
Issue No.11
Issue DateDecember 01, 2013
Publishing DateDecember 01, 2013
KeywordsControl Chart, Six Sigma Tools, SPC


Abstract

The Control Chart is one of the main Six Sigma tools to optimize business processes. After some adjustments it is used now as visualization tool in IT Capacity Management especially in “behavior learning” products to underline performance and capacity usage anomalies. This review answers the following questions. What is the Control Chart and how to read it and where to use? Review of some performance tools that uses it. Control chart types: MASF charts vs. classical SPC; introduction to IT-Control Chart for IT application performance control. How to build a Control Chart using Excel for interactive analysis and R scripting to do it automatically?


Friday, December 20, 2013

I can be seen at G+,t,f,in,VK,YouTube and finely at Researchgate!

I like to be seen. I am here in Blogger and also you can see me at:
- Google+
- Twitter,
- Facebook,
- LinkedIn,
- VKontakte
- YouTube

and finally I have found where my research writings could be seen in particularly:
- ResearchGate

I am welcome you to join, subscribe and follow!

BTW there are a much more there:
...
I need to consider to be there too.... If you are already somewhere where I am not - INVITE!

Friday, December 13, 2013

CMG’13 paper about VMware memory over-commitment, Memory State performance counter, Ballooning, Swapping and Memory Reservations. A few citations.

 I have attended the “ Performance Management in the Virtual Data Center: Virtual Memory Management “  Mark’s B. Friedman presentation and learned a lot. I would like to share here a few most informative (by my opinion) citations from Mark’s paper about

-        Memory over-commitment, 
-        Memory State performance counter,
-        Ballooning, Swapping and
-        Memory Reservations.

Introduction.
“…This paper explores the strategies that VMware ESX employs to manage machine memory, focusing on the ones that are designed to support aggressive consolidation of virtual machine guests on server hardware..”

Memory over-commitment
“…Allowing applications to collectively commit more virtual memory pages than are actually present in physical memory, but biasing the contents of physical memory based on current usage patterns, permits operating systems that support virtual memory addressing to utilize physical memory resources very effectively…”

Memory State performance counter
“…VMware’s current level of physical memory contention is encapsulated in a performance counter called Memory State. This Memory State variable is set based on the amount of Free memory available. Memory state transitions trigger the reclamation actions reported in Table 1:

State
Value
Free Memory Threshold
Reclamation Action
High
0
> 6%
None
Soft
1
< 6%
Ballooning
Hard
2
< 4%
Swapping to Disk or Pages compressed
Low
3
<2 span="">
Blocks execution of active VMs > target allocations
..”

Ballooning
“…ballooning occurs when the VMware Host recognizes that there is a shortage of machine memory and must be replenished using page replacement. Since VMware has only limited knowledge of current page access patterns, it is not in a position to implement an optimal LRU page replacement strategy. Ballooning attempts to shift responsibility for page replacement to the guest machine OS, which presumably can implement a more optimal page replacement strategy than the VMware hypervisor.
…  Using ballooning, VMware reduces the amount of physical memory available for internal use within the guest machine.

In Windows, when VMware’s vmmemsty.sys balloon driver inflates, it allocates physical memory pages and pins them in physical memory until explicitly released. To determine how effective ballooning works to relieve a shortage of machine memory condition, it is useful to drill into the guest machine performance counters and look for signs of increased demand paging and other indicators of memory contention….

…ballooning successfully transforms the external contention for machine memory that the VMware Host detects into contention for physical memory that the Windows guest machine needs to manage internally...”

Swapping
“… VMware has recourse to steal physical memory pages granted to a guest OS at random, which VMware terms swapping, to relieve a serious shortage of machine memory. When free machine memory drops below a 4% threshold, swapping is triggered..”

Memory Reservations.

“In VMware, customers do have the ability to prioritize guest machines so that all tenants sharing an over-committed virtualization Host machine are not penalized equally when there is a resource shortage. The most effective way to protect a critical guest machine from being subjected to ballooning and swapping due to a co-resident guest is to set up a machine memory Reservation. A machine memory Reservation establishes a floor guaranteeing that a certain amount of machine memory is always granted to the guest. With a Reservation value set, VMware will not subject a guest machine to ballooning or swapping that will result in the machine memory granted to the guest falling below that minimum…”