In the CMG'12 conference agenda I see another interesting paper appeared and it is written by Dima Seliverstov who I have met before in another CMG conference and mentioned in this blog .
His paper is called
"Introduction to Wavelets and their Application for Computer Performance Trend and
Anomaly Detection"
The very short abstract is
"In this session, I will present a technique to identify trends and anomalies in Performance data using wavelets. I will answer the following questions: Why use Wavelets? What are Wavelets? How do I use them?"
CMG'12 conference Monday: 2:45 pm ‐ 3:45 pm Subject Area: Capacity Planning
I plan to attend. You?
Popular Post
-
 I have got the comment on my previous post “ BIRT based Control Chart “ with questions about how actually in BIRT the data are prepared for ...
 -
Your are welcome to post to this blog any message related to the Capacity, Performance and/or Availability of computer systems. Just put you...
Tuesday, September 25, 2012
Wavelets and Anomaly Detection - another CMG'12 paper
 He started in 1979 as IBM/370 system engineer. In 1986 he got his PhD. in Robotics at St. Petersburg Technical University (Russia) and then worked as a professor teaching CAD/CAM, Robotics for 12 years. He published 30+ papers and made several presentations for conferences related to the Robotics and Artificial Intelligent fields. In 1999 he moved to the US, worked at Capital One bank as a Capacity Planner. His first CMG.org paper was written and presented in 2001. The next one, "Exception Detection System Based on MASF Technique," won a Best Paper award at CMG'02 and was presented at UKCMG'03 in Oxford, England. He made other tech. presentations at IBM z/Series Expo, SPEC.org, Southern and Central Europe CMG and ran several workshops covering his original method of Anomaly and Change Point Detection (Perfomalist.com). Author of “Performance Anomaly Detection” class (at CMG.com). Worked 2 years as the Capacity team lead for IBM, worked for SunTrust Bank for 3 years and then at IBM for 3 years as Sr. IT Architect. Now he works for Capital One bank as IT Manager at the Cloud Engineering and since 2015 he is a member of CMG.org Board of Directors. Runs UT channel iTrubin
Monday, September 17, 2012
LinkedIn Discussion around Trubin's Availability Formula
 The previous post "Cluster Availability 9's Equation" triggered a very good discussion on LinkedIn Continuous Availability Forum. It currently has 19 comments (!)... I plan to re-post some comments from the discussion here in my blog. (UPDATE: it is re-posted here)
BTW in one of the comments Bill Highleyman (co-author of the Breaking the Availability Barrier) pointed on the mistake in my formula which I corrected by replacing "n+n" with "mn". He also provided the excellent resource about availability calculation where he writes articles at the The Geek Corner for Availability Digest. One of the articles there extends the subject of this ( and couple previous) post and called: "Calculating Availability – Redundant Systems "
As I suspected my formula ("Trubin law") is just a particular case of more generic rule Bill Highleyman formulates in that article. That says:
"... Adding a spare node adds the number of nines associated with that node to the system
availability but reduced by the increase in failure modes.
That is, adding an additional spare node adds the number of 9s of that node to the system
availability – almost. This improvement in availability is reduced a bit by the increase in the
number of failure modes in the system. More nodes mean more failure modes..."
He started in 1979 as IBM/370 system engineer. In 1986 he got his PhD. in Robotics at St. Petersburg Technical University (Russia) and then worked as a professor teaching CAD/CAM, Robotics for 12 years. He published 30+ papers and made several presentations for conferences related to the Robotics and Artificial Intelligent fields. In 1999 he moved to the US, worked at Capital One bank as a Capacity Planner. His first CMG.org paper was written and presented in 2001. The next one, "Exception Detection System Based on MASF Technique," won a Best Paper award at CMG'02 and was presented at UKCMG'03 in Oxford, England. He made other tech. presentations at IBM z/Series Expo, SPEC.org, Southern and Central Europe CMG and ran several workshops covering his original method of Anomaly and Change Point Detection (Perfomalist.com). Author of “Performance Anomaly Detection” class (at CMG.com). Worked 2 years as the Capacity team lead for IBM, worked for SunTrust Bank for 3 years and then at IBM for 3 years as Sr. IT Architect. Now he works for Capital One bank as IT Manager at the Cloud Engineering and since 2015 he is a member of CMG.org Board of Directors. Runs UT channel iTrubin
Friday, September 14, 2012
Cluster Availability 9's Equation

But how that would work for other single node availability numbers? What if that has two or three 9's? I have generalized my previous equation to cover that and it shows that the cluster availability number of 9's will be increasing in arithmetic progression (sequence)!
He started in 1979 as IBM/370 system engineer. In 1986 he got his PhD. in Robotics at St. Petersburg Technical University (Russia) and then worked as a professor teaching CAD/CAM, Robotics for 12 years. He published 30+ papers and made several presentations for conferences related to the Robotics and Artificial Intelligent fields. In 1999 he moved to the US, worked at Capital One bank as a Capacity Planner. His first CMG.org paper was written and presented in 2001. The next one, "Exception Detection System Based on MASF Technique," won a Best Paper award at CMG'02 and was presented at UKCMG'03 in Oxford, England. He made other tech. presentations at IBM z/Series Expo, SPEC.org, Southern and Central Europe CMG and ran several workshops covering his original method of Anomaly and Change Point Detection (Perfomalist.com). Author of “Performance Anomaly Detection” class (at CMG.com). Worked 2 years as the Capacity team lead for IBM, worked for SunTrust Bank for 3 years and then at IBM for 3 years as Sr. IT Architect. Now he works for Capital One bank as IT Manager at the Cloud Engineering and since 2015 he is a member of CMG.org Board of Directors. Runs UT channel iTrubin
Wednesday, September 12, 2012
The Right Number of Cluster Redundancy to Achieve the Availability Goal. Trubin's Law #4!
...Still playing with the availability algebra exercise, that I started in my other post: How to Calculate Availability of Clustered Infrastructure for Multi-Tier Application
I have built the following two charts to see how the same availability goal can be achieved by different number of redundancy.

That of course possible if the less redundant configuration has more available individual components.

That of course possible if the less redundant configuration has more available individual components.
By the way, interesting that if the component availability has one 9's (90.00%), then increasing redundancy on +1 gives the additional one 9's for the cluster availability.
So, the equation
has the following solution: A=0.9 for any integer n within the interval (0,∞)
It is probably the known law in the availability algebra. If not let's call that Trubin's law #4! ;)
________
This Saga of 9's continuous in the next post:
________
This Saga of 9's continuous in the next post:
Cluster Availability 9's Equation
He started in 1979 as IBM/370 system engineer. In 1986 he got his PhD. in Robotics at St. Petersburg Technical University (Russia) and then worked as a professor teaching CAD/CAM, Robotics for 12 years. He published 30+ papers and made several presentations for conferences related to the Robotics and Artificial Intelligent fields. In 1999 he moved to the US, worked at Capital One bank as a Capacity Planner. His first CMG.org paper was written and presented in 2001. The next one, "Exception Detection System Based on MASF Technique," won a Best Paper award at CMG'02 and was presented at UKCMG'03 in Oxford, England. He made other tech. presentations at IBM z/Series Expo, SPEC.org, Southern and Central Europe CMG and ran several workshops covering his original method of Anomaly and Change Point Detection (Perfomalist.com). Author of “Performance Anomaly Detection” class (at CMG.com). Worked 2 years as the Capacity team lead for IBM, worked for SunTrust Bank for 3 years and then at IBM for 3 years as Sr. IT Architect. Now he works for Capital One bank as IT Manager at the Cloud Engineering and since 2015 he is a member of CMG.org Board of Directors. Runs UT channel iTrubin
Friday, September 7, 2012
EV Based Trend Display - Trubin's Criterion!
Very typical task is to display trend direction on a dashboard type of report. Here is an example from SAS website:


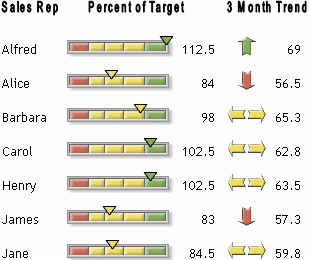
But how correctly to choose the direction? Based on
what? My suggestion is to
use Exception Value (EV) meta metric (Check how that should
be calculated here: EV-Control Chart). Indeed, for the given
most recent time period (e.g. day, week or month) EV will be greater than 0 , if more
UCL crossings happened than LCL crossings; EV
will be 0 if everything occurred within
UCL-LCL band; and EV will be less than 0, if more LCL crossings happened than UCL crossings.
That criterion have been already used to detect most recent trends, but the same
way that could be used to choose the right direction for the trend arrow on
dashboards!
So the
Trubin's Criterion would be:
He started in 1979 as IBM/370 system engineer. In 1986 he got his PhD. in Robotics at St. Petersburg Technical University (Russia) and then worked as a professor teaching CAD/CAM, Robotics for 12 years. He published 30+ papers and made several presentations for conferences related to the Robotics and Artificial Intelligent fields. In 1999 he moved to the US, worked at Capital One bank as a Capacity Planner. His first CMG.org paper was written and presented in 2001. The next one, "Exception Detection System Based on MASF Technique," won a Best Paper award at CMG'02 and was presented at UKCMG'03 in Oxford, England. He made other tech. presentations at IBM z/Series Expo, SPEC.org, Southern and Central Europe CMG and ran several workshops covering his original method of Anomaly and Change Point Detection (Perfomalist.com). Author of “Performance Anomaly Detection” class (at CMG.com). Worked 2 years as the Capacity team lead for IBM, worked for SunTrust Bank for 3 years and then at IBM for 3 years as Sr. IT Architect. Now he works for Capital One bank as IT Manager at the Cloud Engineering and since 2015 he is a member of CMG.org Board of Directors. Runs UT channel iTrubin
Subscribe to:
Posts (Atom)